Tarakan Weather & Climate: Best Time to Visit
With consistently stable weather, Tarakan, East Kalimantan, Indonesia, sees little seasonal temperature change. Daytime highs average 30°C (86°F), ranging from 30°C (86°F) in May to 29°C (84°F) in January.
With around 3008 mm (118 in) of annual rainfall, Tarakan has a notably wet climate. The wettest month is December. The sunniest month is July, with 5.7 hours of sunshine per day on average.
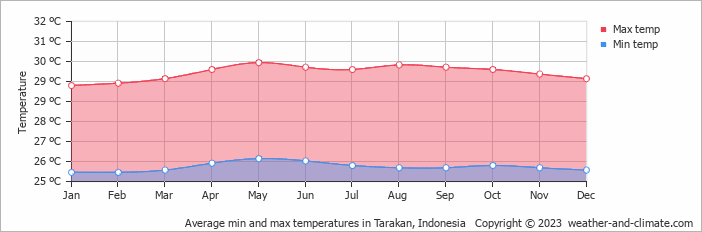
Monthly Temperature in Tarakan
The climate in Tarakan remains fairly constant, offering comfortable temperatures throughout the year. Average daytime temperatures reach a very warm 30°C (86°F) in May. In January, the coolest month of the year, temperatures drop to a comfortable 29°C (84°F).
At night, temperatures range from around 26°C (79°F) in May to 25°C (77°F) in January.
Check out our detailed temperature page for more information.
Temperature ranges by month
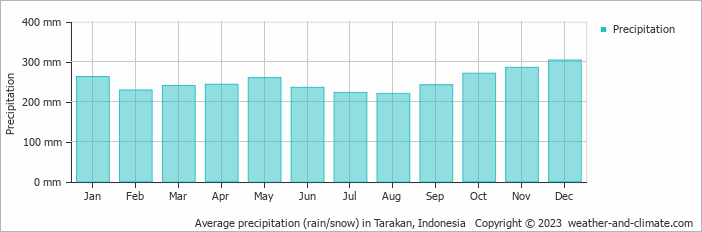
Rainfall in Tarakan
Tarakan is known for its substantial rainfall, with annual precipitation reaching 3008 mm (118 in). Despite minor fluctuations, Tarakan enjoys fairly consistent precipitation throughout the year. In December, you can expect around 303 mm (12 in) of precipitation, while in August, Tarakan receives about 220 mm (8.7 in). For more details, please visit our Tarakan Precipitation page.
The mean monthly precipitation over the year, including rain, hail, and snow
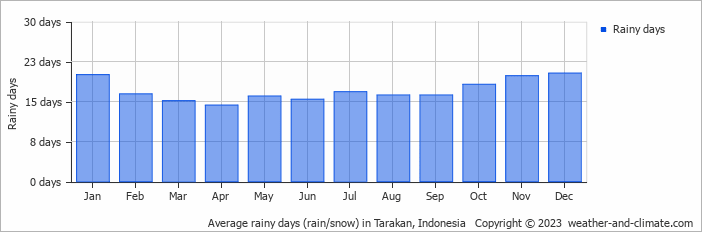
The average number of days each month with precipitation
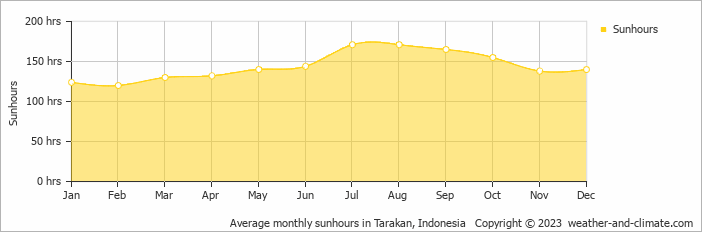
Sunshine Hours in Tarakan
Tarakan experiences moderate variation in sunshine hours across the seasons. With 5.7 hours daily sunshine in July, it dips to 4.0 hours in February, offering a balanced mix of sunny and overcast days.
Visit our detailed sunshine hours page for more information.
Monthly hours of sunshine
Daily hours of sunshine
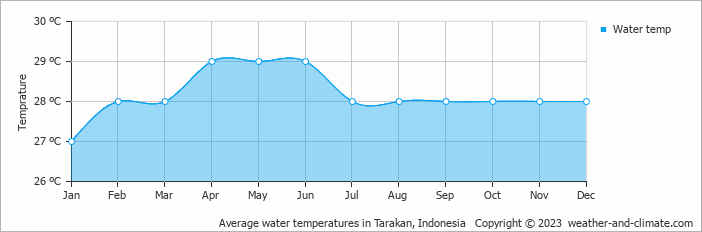
Water Temperature in Tarakan
The mean water temperature over the year ranges from 27°C (81°F) in January to 29°C (84°F) in April.
Water temperature over the year
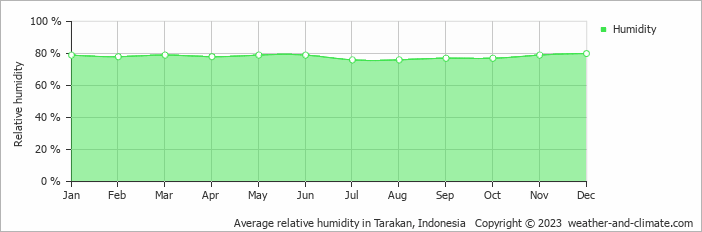
Humidity in Tarakan by Month
The relative humidity is high throughout the year in Tarakan.
The city experiences its highest humidity in December, reaching 80%. In July, the humidity drops to its lowest level at 76%. What does this mean? Read our detailed page on humidity levels for further details.
Relative humidity over the year
Tarakan 3-Day Forecast
Check the conditions for any month of the year.
Best Time to Visit Tarakan
The weather in Tarakan is characterized by year-round heavy rainfall, with no month offering relief from the wet conditions. All months exceed 160 mm (6.3 in) of precipitation, creating a consistently humid environment. If forced to choose, August offers the lowest rainfall at 220 mm (8.7 in).Embrace the wet climate by bringing proper rain gear and plan activities that are indoor. Ready to plan your travels but need destination ideas? Our smart tool recommends places based on the climate conditions you prefer. Start planning with our destination weather tool.


