Altdorf Weather & Climate: Best Time to Visit
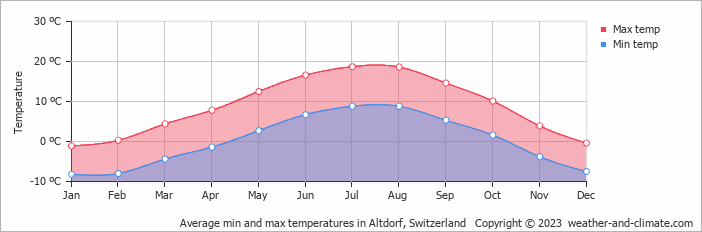
Altdorf, Uri, Switzerland, sees big temperature differences between seasons, with July peaking at 19°C (66°F) and January dropping to -1°C (30°F).
Rain/snowfall is high, totalling around 1990 mm (78 in) per year. August is the wettest month and February the driest. The city also experiences a distinct rainy season from May to September. The sunniest month is July, with 5.6 hours of sunshine per day on average.
Monthly Temperature in Altdorf
Visitors to Altdorf can expect significant temperature changes throughout the year. Average maximum daytime temperatures range from a pleasant 19°C (66°F) in July, the warmest time of the year, to a very cold -1°C (30°F) during cooler months like January.
At night, you can expect temperatures ranging from 9°C (48°F) in July to around -8°C (18°F) during January.
Check out our detailed temperature page for more information.
Temperature ranges by month
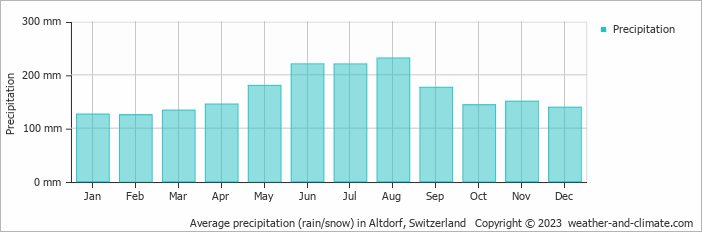
Rainfall in Altdorf
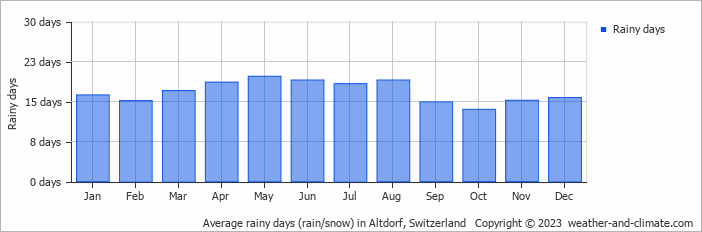
Altdorf is known for its substantial rain/snowfall, with annual precipitation reaching 1990 mm (78 in). While rainfall varies throughout the year, each season offers its own charm. August brings wetter days averaging 231 mm (9.1 in) of precipitation, spread over 19 rainy days.
In contrast, the driest month February experiences a drier climate, with about 125 mm (4.9 in) of snowfall spread across 15 snowy days. For more details, please visit our Altdorf Precipitation page.
The mean monthly precipitation over the year, including rain, hail, and snow
The average number of days each month with precipitation
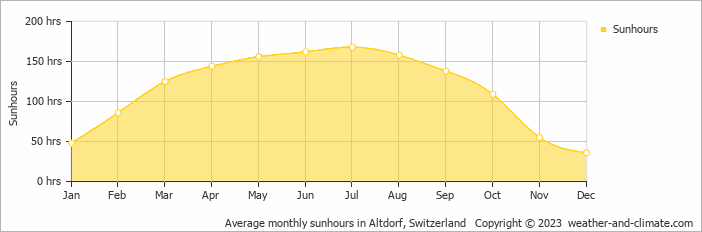
Sunshine Hours in Altdorf
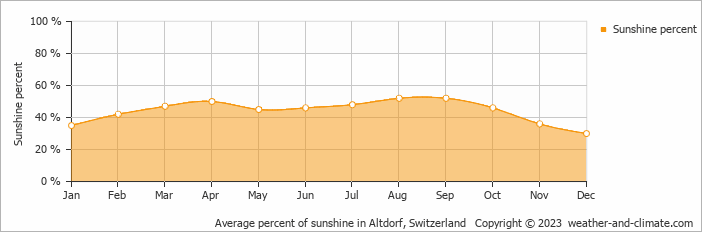
Seasonal changes in sunshine hours are quite dramatic in Altdorf. While July receives considerable daily sunshine with up to 5.6 hours, December marks the darkest time of the year, where sunshine is scarce with only 1.2 hours of sunlight per day.
Visit our detailed sunshine hours page for more information.
Monthly hours of sunshine
Daily hours of sunshine
Daily percentage of sunshine
Humidity in Altdorf by Month
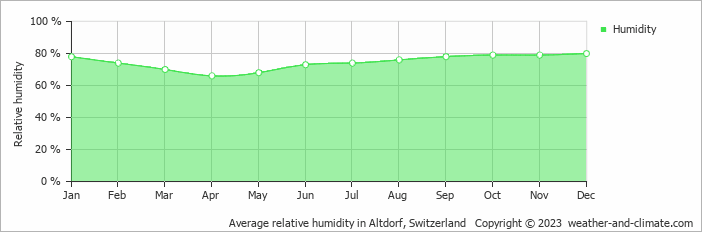
The relative humidity is high throughout the year in Altdorf.
The city experiences its highest humidity in December, reaching 80%. In April, the humidity drops to its lowest level at 66%. What does this mean? Read our detailed page on humidity levels for further details.
Relative humidity over the year
Wind Speed in Altdorf
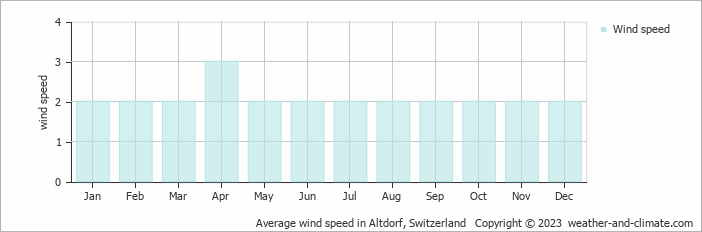
The mean wind speed varies between 2 m/s (4 knots) and 3 m/s (6 knots) throughout the year. It is lowest in January, February, March, May, June, July, August, September, October, November and December and highest during April. What does this mean?
The mean monthly wind speed over the year (meters per second)
Altdorf 3-Day Forecast
Check the conditions for any month of the year.
Best Time to Visit Altdorf
Weather conditions in Altdorf change throughout the year, providing varied experiences for travelers. Each season offers its own distinct characteristics. If we needed to point out one month as the best to visit, it would be October, a good month to visit with 144 mm (5.7 in) of rainfall.Keep in mind that May, June, July, August and September represent the wettest months of the year. Looking for inspiration on where to travel this year? We have a tool that recommends destinations based on your ideal conditions. Find out where to go with our weather planner.