Average humidity in Veiðilundur
On this page you find more information about the monthly relative humidity over the year in Veiðilundur (), Iceland.
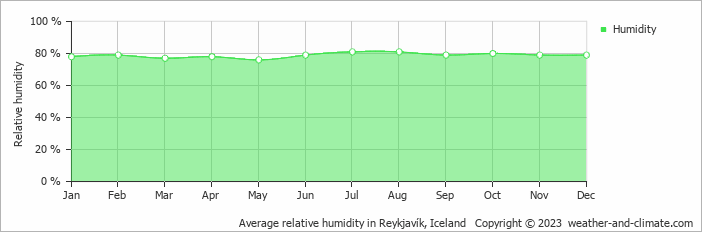
Veiðilundur's humidity levels vary throughout the year. The highest levels occur in July, reaching 81% (very high), while the lowest is recorded in May at 76%.
Throughout the year, the average humidity in Veiðilundur is 79%.
Humidity plays an important role in how temperatures are felt. During the warmest month, July, the maximum average temperature is around 15°C (59°F).
During the coldest month, January, the maximum average temperature is around 2°C (36°F). This period has high humidity. When winter temperatures are low and humidity is high, it can make the air feel even colder than it actually is. Check out our detailed temperature page for more information.
Veiðilundur Weather by Month
Pick a month to see the average temperature, rainfall and sunshine in Veiðilundur - and find the best time to visit.

Veiðilundur 3-Day Forecast
Temperature Rainfall Sunshine Humidity
See the full Veiðilundur climate overview or explore weather in Iceland.
Popular this month
Where to go in August - average daytime high across popular destinations.
 Hella
Hella 16°C (61°F) Selfoss15°C (59°F) Reykjavík15°C (59°F) Kópavogur15°C (59°F) Egilsstadir
 13°C (55°F) Keflavík13°C (55°F) Höfn
 12°C (54°F) Akureyri13°C (55°F)













Bucket list
Need travel inspiration? Check out our bucket list articles and be inspired.
Iceland Airwaves Festival
On its way to its 20th edition in 2019 Iceland Airwaves is a festival you need to visit once in your life. Everything from lagoons and bookstores to bars and concert halls is filled with music.
Where to stay in Iceland: Nordic idyll that feels like home
If you are travelling to Iceland for the first time, the Golden Circle will probably make it onto your bucket list. Geysir Hestar is located right in between two spectacular sights of the Golden Circle.
 See the northern lights
The northern lights, polar light or Aarora Borealis is a true spectacle of nature! Green, sometimes purple, red and yellow streaks of light colors the dark skies.