















 The 10 most alternative cities in South America
Discover South America's top 10 alternative cities! From Valparaíso's vibrant streets to La Paz's high-altitude charm and Medellín's innovative spirit.
On this page you find more information about the monthly relative humidity over the year in El Quisco (Valparaíso Region), Chile.
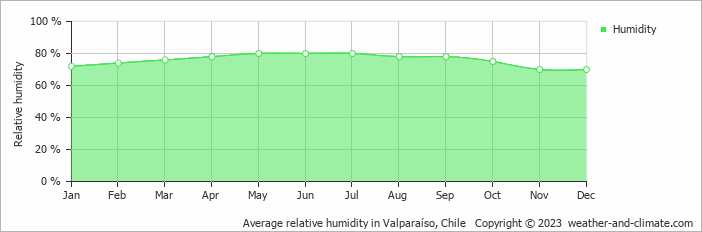
El Quisco's humidity levels vary throughout the year. The highest levels occur in May, reaching 80% (very high), while the lowest is recorded in November at 70%.
Throughout the year, the average humidity in El Quisco is 76%.
Humidity plays an important role in how temperatures are felt. During the warmest month, January, the maximum average temperature is around 19°C (66°F).
During the coldest month, July, the maximum average temperature is around 14°C (57°F). This period has very high humidity. Check out our detailed temperature page for more information.
Pick a month to see the average temperature, rainfall and sunshine in El Quisco - and find the best time to visit.
Temperature Rainfall Sunshine Humidity
See the full El Quisco climate overview or explore weather in Chile.
Where to go in October - average daytime high across popular destinations.
 San Pedro de Atacama
 23°C (73°F) Hanga Roa
 21°C (70°F) Santiago21°C (70°F) La Serena
 21°C (70°F) Viña del Mar17°C (63°F) Valparaíso16°C (61°F) Pucón
 15°C (59°F)
 Need travel inspiration? Check out our bucket list articles and be inspired.
The 10 most alternative cities in South America
Discover South America's top 10 alternative cities! From Valparaíso's vibrant streets to La Paz's high-altitude charm and Medellín's innovative spirit.
 Torres del Paine
Torres del Paine is an huge national park on the border with Argentina. It is possible to walk here along craters, high-rising mountain ridges, over glaciers and through vast majestic tundra.
 Explore Patagonia
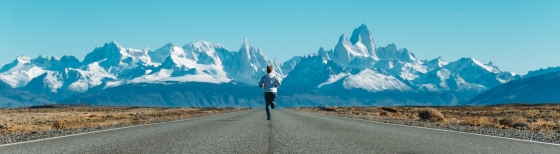
A tour through Patagonia brings you to the end of the world. That’s why Patagonia is a bucket list destination for many. We recommend to visit Patagonia from November to early March.
 Enjoy the silence and peace in a spectacular landscape
This lodge guarantees privacy and exclusivity for those seeking to get away from mass tourism and enjoy the silence and peace in a spectacular landscape.