
















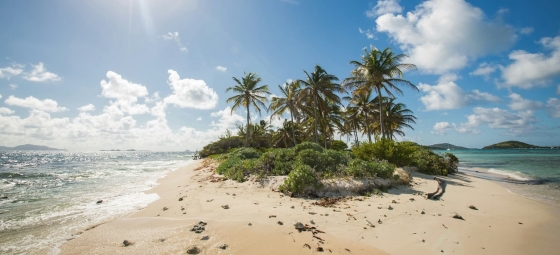
 10 Hidden gems in Asia you need to visit
Explore 10 hidden gems in Asia offering authentic experiences, from pristine beaches and remote islands to cultural treks and peaceful mountain villages.
On this page you find more information about the monthly relative humidity over the year in Chŏng Chéach (), Cambodia.

Chŏng Chéach's humidity levels vary throughout the year. The highest levels occur in October, reaching 85% (very high), while the lowest is recorded in January at 69%.
Throughout the year, the average humidity in Chŏng Chéach is 77%.
Humidity plays an important role in how temperatures are felt. During the warmest month, March, the maximum average temperature is around 37°C (99°F). Combined with high humidity during this period, the temperature can feel even warmer than the thermometer shows.
During the coldest month, September, the maximum average temperature is around 32°C (90°F). This period has very high humidity. Check out our detailed temperature page for more information.
Pick a month to see the average temperature, rainfall and sunshine in Chŏng Chéach - and find the best time to visit.
Temperature Rainfall Sunshine Humidity
See the full Chŏng Chéach climate overview or explore weather in Cambodia.
Where to go in October - average daytime high across popular destinations.
 Battambang
 33°C (91°F) Phnom Penh33°C (91°F) Siem Reap32°C (90°F) Chambok31°C (88°F) Kep31°C (88°F) Kampot30°C (86°F) Sihanoukville30°C (86°F) Koh Rong Island29°C (84°F)
 Need travel inspiration? Check out our bucket list articles and be inspired.
10 Hidden gems in Asia you need to visit
Explore 10 hidden gems in Asia offering authentic experiences, from pristine beaches and remote islands to cultural treks and peaceful mountain villages.
 Staying in an artwork
Situated between three of Cambodia's oldest nature parks you can find a work of art created by world-famous architect Bill Bensley called Shinta Mani Wild.
 Exploring Cambodia by Bicycle
Discover the wonders of Cambodia on a bicycle tour, exploring its history, culture, and breathtaking landscapes. Ideal for all levels of cyclists.
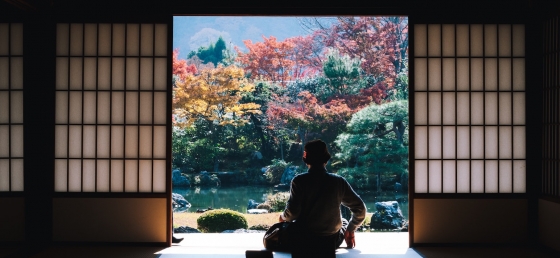
 Chase the autumn leaves in Japan
Japan is one of these cases which turns into a gold, yellow and orange fairy tale starting from September. And we can honestly say: We cannot imagine a more beautiful season to visit Japan.