















 The 10 most alternative cities in South America
Discover South America's top 10 alternative cities! From Valparaíso's vibrant streets to La Paz's high-altitude charm and Medellín's innovative spirit.
On this page you find more information about the monthly relative humidity over the year in Chapada dos Guimarães (Mato Grosso), Brazil.
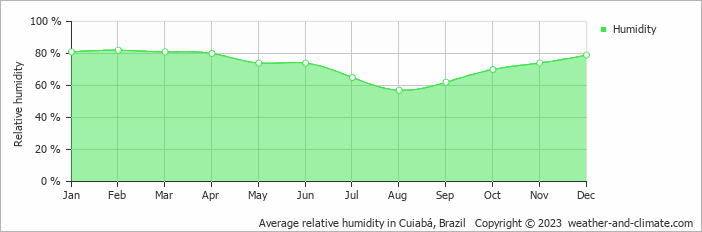
Chapada dos Guimarães's humidity levels vary throughout the year. The highest levels occur in February, reaching 82% (very high), while the lowest is recorded in August at 57%.
Throughout the year, the average humidity in Chapada dos Guimarães is 73%.
Humidity plays an important role in how temperatures are felt. During the warmest month, September, the maximum average temperature is around 34°C (93°F). Combined with high humidity during this period, the temperature can feel even warmer than the thermometer shows.
During the coldest month, May, the maximum average temperature is around 31°C (88°F). This period has high humidity. Check out our detailed temperature page for more information.
Pick a month to see the average temperature, rainfall and sunshine in Chapada dos Guimarães - and find the best time to visit.
Temperature Rainfall Sunshine Humidity
See the full Chapada dos Guimarães climate overview or explore weather in Brazil.
Where to go in October - average daytime high across popular destinations.
 Fortaleza
 31°C (88°F) Rio de Janeiro
 28°C (82°F) Salvador
 28°C (82°F) Sao Paulo27°C (81°F) Búzios
 25°C (77°F) Paraty
 25°C (77°F) Gramado24°C (75°F) Florianópolis24°C (75°F)
 Need travel inspiration? Check out our bucket list articles and be inspired.
The 10 most alternative cities in South America
Discover South America's top 10 alternative cities! From Valparaíso's vibrant streets to La Paz's high-altitude charm and Medellín's innovative spirit.
 The 5 most tranquil retreats in the Amazon Rainforest, Brazil
Discover top sustainable lodges in the Amazon. Enjoy unique wildlife, eco-friendly stays, and immersive experiences at Anavilhanas, Cristalino, and more.
 Brazil in November: Where Is the Best Weather?
Discover where Brazil has the best weather in November, comparing Fortaleza, Salvador, Rio, São Paulo, Florianópolis, Brasília and Foz do Iguaçu.
 An alternative way to discover Rio de Janeiro
Don't feel like seeing the traditional tourist sights in Rio de Janeiro? We have made an overview of the sights in Rio de Janeiro that you must see if you want to visit Rio in an alternative way.