














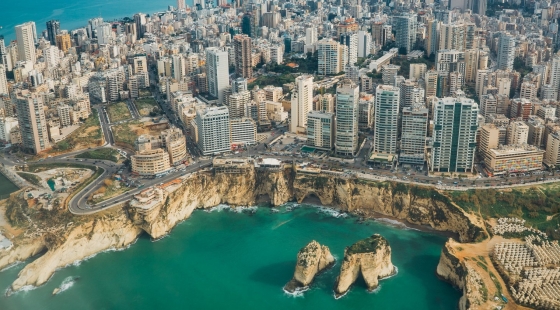
 The ever-intriguing Beirut
Everything you hear about Beirut is true and it's a fact that you will not get bored in this fascinating capital. The best travel time for Beirut is from October to May.
On this page you find the mean water temperature over the year in Trâblous (North Governorate), Lebanon. Take a closer look at the water temperature patterns and what they mean for swimming and recreation.
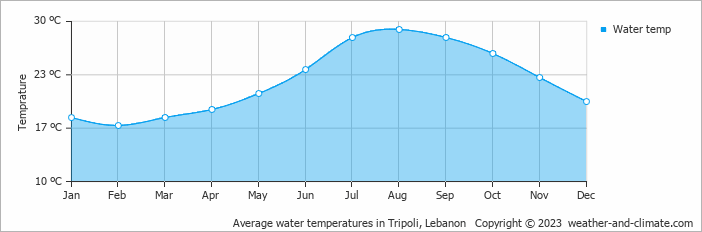
Trâblous experiences water temperature shifts throughout the year. The warmest month, August, reaches an average of 29°C (84°F).
The coldest month, February, averages 17°C (63°F). Visitors during these months can leave their swimming gear at home.
Pick a month to see the average temperature, rainfall and sunshine in Trâblous - and find the best time to visit.
Temperature Rainfall Humidity Water Temp
See the full Trâblous climate overview or explore weather in Lebanon.
Where to go in October - average daytime high across popular destinations.
Beirut 27°C (81°F) Jounieh26°C (79°F) Ehden
 24°C (75°F) Jbeil25°C (77°F) Kfardebian24°C (75°F) Fārayyā24°C (75°F) Bcharré24°C (75°F) Al Arz23°C (73°F)
 Need travel inspiration? Check out our bucket list articles and be inspired.
The ever-intriguing Beirut
Everything you hear about Beirut is true and it's a fact that you will not get bored in this fascinating capital. The best travel time for Beirut is from October to May.
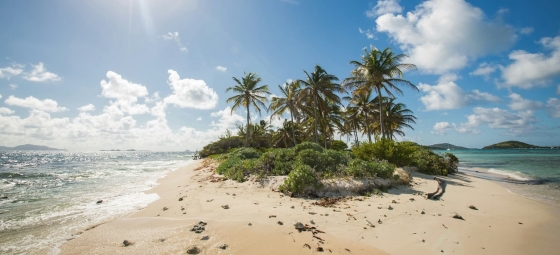
 10 Hidden gems in Asia you need to visit
Explore 10 hidden gems in Asia offering authentic experiences, from pristine beaches and remote islands to cultural treks and peaceful mountain villages.
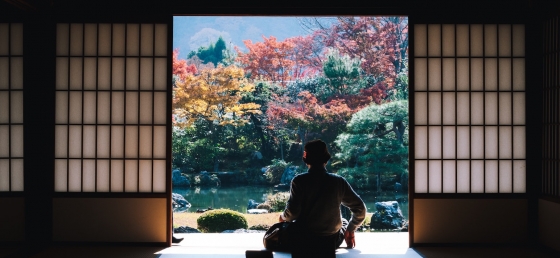
 Chase the autumn leaves in Japan
Japan is one of these cases which turns into a gold, yellow and orange fairy tale starting from September. And we can honestly say: We cannot imagine a more beautiful season to visit Japan.

 The 10 Most Exquisite Beaches in the Philippines
Explore the top 10 breathtaking beaches in the Philippines, from serene Nacpan Beach to volcanic Camiguin Island, in our detailed guide.