Climate ▸Forecast ▸February ▸March ▸
JanuaryFebruaryMarchAprilMayJuneJulyAugustSeptemberOctoberNovemberDecember

Average water temperature in Moriani Plage

On this page you find the mean water temperature over the year in Moriani Plage (), France. Discover when the water is at its warmest and coolest, perfect for planning your visit.

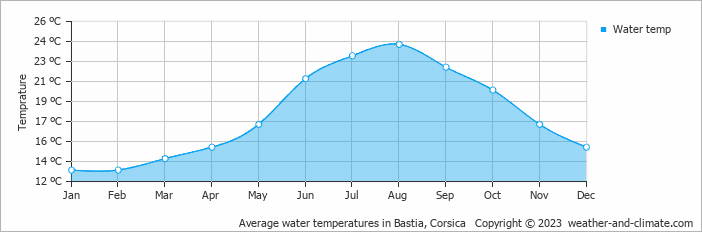
Data from: Bastia, Corsica (20 KM, 12 Miles).

In Moriani Plage, the water undergoes seasonal changes. The warmest month is August, with an average water temperature of 24°C.

The coldest water temperature month, January, has an average temperature of 13°C. It may not be the ideal time for a swim.


Forecast for Moriani Plage

Monday
17 Feb
Light rain
Light rain
15°C
0.1 mm
Tuesday
18 Feb
Light rain
Light rain
12°C
2.4 mm
Wednesday
19 Feb
Heavy rain
Heavy rain
12°C
16 mm

Interested in more climate information?

This site provides you with all the information you need about the climate in Moriani Plage.

Our site offers climate and forecast data for every country in the world. Are you going to France? On this website you can find historical weather averages for many cities in France. Not sure yet where to go? We now have a tool which recommends destinations that suit your ideal travel conditions. Find out where to go with our weather planner.

) ?>