
















 The Li River: A Journey Through China’s Most Breathtaking Landscape
Explore the Li River, China's breathtaking landscape with majestic mountains, serene waters, and picturesque views. A must-see for every traveler.
This page shows both the average monthly rainfall and the number of rainy days in Yanggu, China. This average is based on long-term data collected between 1990 and 2020. Let's explore the details to provide you with a complete overview.
Generally, Yanggu receives mid-range precipitation levels, with 665 mm (26 in) annually. The distribution varies significantly throughout the year, with a distinct dry season during certain months, as shown in our charts below.
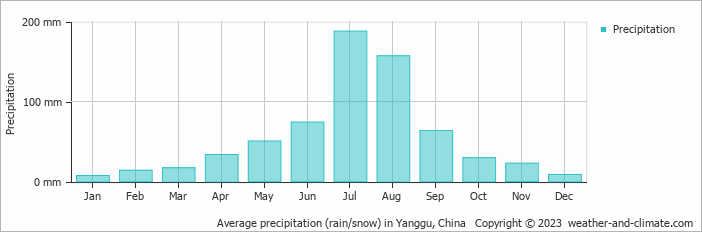
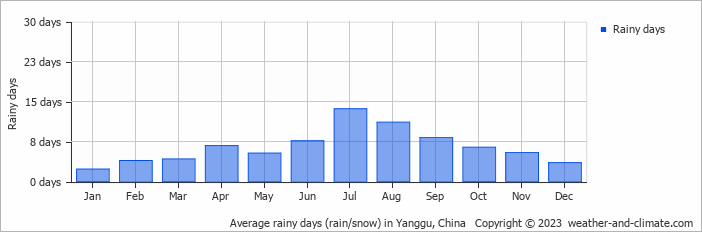
Yanggu can be quite wet during July, receiving approximately 188 mm (7.4 in) of precipitation over 14 rainy days.
In contrast January, experiences much drier conditions, with 7.3 mm (0.3 in) of snow/rainfall, spread across 2 snowy/rainy days.
July, the wettest month, has a maximum daytime temperature of 33°C (91°F). During the driest month January you can expect a temperature of 6°C (43°F). For more detailed insights into the city's temperatures, visit our Yanggu Temperature page.
The map below shows the annual precipitation across China. You can also select the different months in case you are interested in a specific month.
Yanggu's average annual precipitation is 665 mm (26 in). Let's compare this to some popular worldwide tourist destinations:
New York City, USA, receives 1276 mm (50 in) of rainfall annually, with precipitation evenly distributed throughout the year.
Beijing, China, receives 560 mm (22 in) of annual precipitation, concentrated in the summer months.
Melbourne, Australia, has 690 mm (27 in) of rainfall annually, spread fairly evenly throughout the year.
Singapore, situated near the equator, gets 2581 mm (102 in) of rainfall annually, with no distinct dry season and consistent monthly precipitation.
Precipitation amounts are measured using specific gauges installed at weather stations, collecting both rain and snow and any other type of precipitation. Rainfall is measured directly in millimeters, while that from snow and ice is obtained by melting it. Automated systems often incorporate heaters to make this easier.
Information from these stations is transmitted via Wi-Fi, satellite, GPS, or telephone connections to central monitoring networks. This information is immediately updated and integrated into weather models and forecasts.
The proximity of a location to a large body of water can significantly affect its rainfall patterns:
For more detailed information about Yanggu's weather, including sunshine hours, humidity levels, and temperature data, visit our Yanggu Climate page.
Pick a month to see the average temperature, rainfall and sunshine in Yanggu - and find the best time to visit.
Temperature Rainfall
See the full Yanggu climate overview or explore weather in China.
Where to go in October - average daytime high across popular destinations.
Guangzhou 30°C (86°F) Shenzhen29°C (84°F) Hangzhou25°C (77°F) Shanghai24°C (75°F) Chengdu
 22°C (72°F) Xi'an
 21°C (70°F) Beijing
 21°C (70°F) Qingdao21°C (70°F)
 Need travel inspiration? Check out our bucket list articles and be inspired.
The Li River: A Journey Through China’s Most Breathtaking Landscape
Explore the Li River, China's breathtaking landscape with majestic mountains, serene waters, and picturesque views. A must-see for every traveler.
 Go to China's Zhangjiajie National Park with the highest, the fastest, largest-loaded outdoor elevator in the world
You won't find this unique landscape anywhere else in the world. Thousands of floating mountains overgrown with trees at the top dominate this fairy tale landscape.
 Go to Xinjiang in China
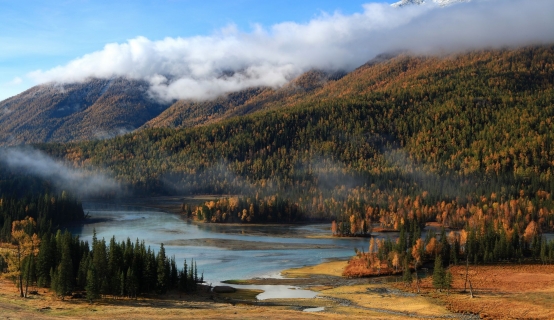
In Xinjiang you get to see a mix of East and Central Asia. An experience that you might want to add to your bucket list. You can travel through the province as if you are following an ancient silk route.
 Mount Kailash
The best time for a Kailash tour/trekking is from mid-May to mid-October when the temperature is most pleasant. It is warm, dry and sunny in that period.