Wolbórz Precipitation: Average Monthly Rainfall and Snowfall
This graph shows the average amount of rainfall per month in Wolbórz (Lodz). The numbers are calculated over a 30-year period to provide a reliable average.
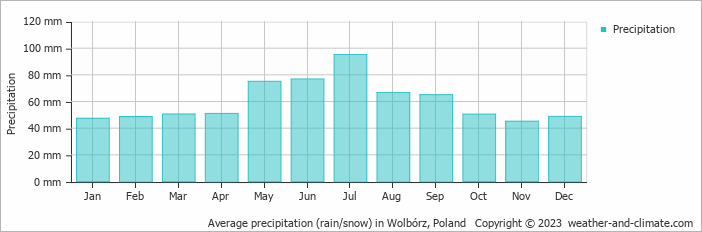
- On average, July is the wettest month with 95 mm of precipitation.
- On average, November is the driest month with 45 mm of precipitation.
- The average amount of annual precipitation is 720 mm.
Current rainfall in Wolbórz
Sat Nov 23
2°C | -1°C
W  22 km/h
22 km/hovercast and no rain
Sun Nov 24
4°C | -1°C
S 18 km/h
18 km/h0.3 mm
overcast and chance of slight rain
Mon Nov 25
9°C | 2°C
S 14 km/h
14 km/hclear and no rain


