Tolmin Monthly Rainfall & Precipitation
This page shows both the average monthly rainfall and the number of rainy days in Tolmin, Slovenian Littoral (Primorska), Slovenia. These values are calculated using 30 years of data (1990–2020) to ensure accuracy. Now, let's break down all the details for a clearer picture.
Tolmin has a relatively rain/snowy climate with high precipitation levels, averaging 1810 mm (71 in) of rain/snowfall annually. Despite the high annual total, it does experience a distinct rainy season during certain months. Examine our detailed charts below to understand these seasonal patterns.
Monthly Precipitation Levels

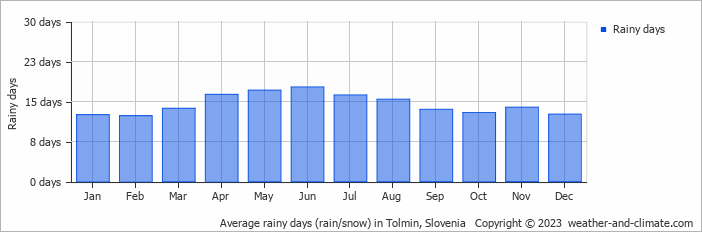
The average number of days each month with precipitation (> 0.2 mm (0.01 in))
Tolmin experiences moderate seasonal variation in rainfall, with monthly averages ranging from 200 mm (7.9 in) in November, the wettest month, and 93 mm (3.7 in) in January, the driest month.
November, the wettest month, has a maximum daytime temperature of 9°C (48°F). The city receives 117 hours of sunshine in this period. During the driest month January you can expect a temperature of 4°C (39°F). For more detailed insights into the city's temperatures, visit our Tolmin Temperature page.
Daily Historical Precipitation
50-year average (1976-2025)
Average daily rainfall for each day of the month based on long-term records.
Average precipitation in July
Explore Tolmin's Historical Precipitation: 1976-2026
Browse day-by-day precipitation records for Tolmin spanning 51 years. Select any month and year to see actual rainfall and snowfall recorded on each day.
Annual Rainfall in Slovenia: City Comparison
The map below shows the annual precipitation across Slovenia. You can also select the different months in case you are interested in a specific month.
 heavy rainfall
 high
high
 moderate
 low
low
 almost none
Tolmin vs World: Rainfall Compared
Tolmin's average annual precipitation is 1810 mm (71 in). Let's compare this to some popular worldwide tourist destinations:
Chicago, USA, sees an annual precipitation of 1062 mm (42 in), with rain and snow contributing to its humid climate.
In Shanghai, China, the annual average precipitation is 1347 mm (53 in), with a humid subtropical climate.
Perth, Australia, receives 565 mm (22 in) of rainfall annually, mostly during the winter months.
Mumbai, India, experiences a tropical monsoon climate with 1860 mm (73 in) of annual rainfall, with the majority of precipitation happening during the monsoon season from June to September.
Precipitation amounts are measured using specific gauges installed at weather stations, collecting both rain and snow and any other type of precipitation. Rainfall is measured directly in millimeters, while that from snow and ice is obtained by melting it. Automated systems often incorporate heaters to make this easier.
Information from these stations is transmitted via Wi-Fi, satellite, GPS, or telephone connections to central monitoring networks. This information is immediately updated and integrated into weather models and forecasts.
- Mawsynram in India is noted as being the wettest place on earth, with over 11 meters (36 feet) of rain falling every year.
- In contrast, Antofagasta in Chile is among the driest places on the planet, getting less than 0.1mm (0.004 inches) per year, with some years recording virtually no rainfall.
- Nearly 1,650 thunderstorm cells are estimated over the planet at any given time.
For more detailed information about Tolmin's weather, including sunshine hours, humidity levels, and temperature data, visit our Tolmin Climate page.


