Santa Venerina Monthly Rainfall & Precipitation
This page shows both the average monthly rainfall and the number of rainy days in Santa Venerina, Sicily, Italy. These averages rely on historical data collected over 30 years, from 1990 to 2020. Let's now guide you through the details for a complete overview.
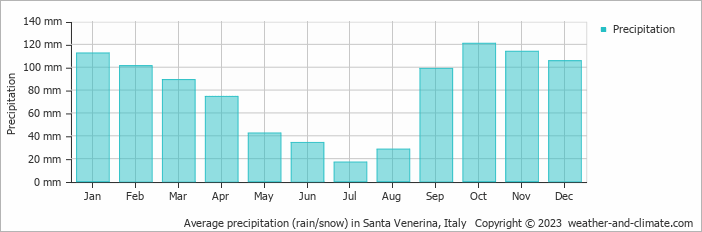
Generally, Santa Venerina receives mid-range precipitation levels, with 937 mm (37 in) annually. The distribution varies significantly throughout the year, with a distinct dry season during certain months, as shown in our charts below.
Monthly Precipitation Levels
The average number of days each month with precipitation (> 0.2 mm (0.01 in))
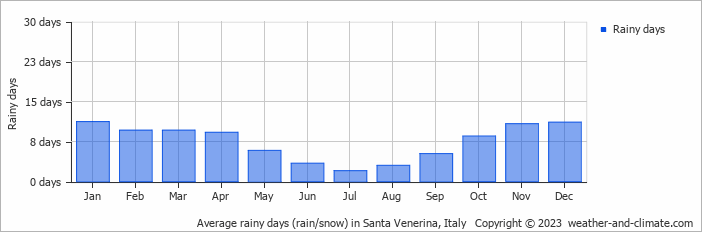
Significant seasonal changes in precipitation occur throughout the year. During the wettest month, October receives substantial rainfall, averaging 121 mm (4.8 in) of precipitation, recorded across 9 rainy days.
In contrast, the driest month, July brings less rainfall, with 17 mm (0.7 in) over 2 rainy days.
October, the wettest month, has a maximum daytime temperature of 22°C (72°F). The city receives 186 hours of sunshine in this period. During the driest month July you can expect a temperature of 28°C (82°F). For more detailed insights into the city's temperatures, visit our Santa Venerina Temperature page.
Annual Rainfall in Italy: City Comparison
The map below shows the annual precipitation across Italy. You can also select the different months in case you are interested in a specific month.
 heavy rainfall
 high
high
 moderate
 low
low
 almost none
Santa Venerina vs World: Rainfall Compared
Santa Venerina's average annual precipitation is 937 mm (37 in). Let's compare this to some popular worldwide tourist destinations:
Chicago, USA, sees an annual precipitation of 1062 mm (42 in), with rain and snow contributing to its humid climate.
Osaka, Japan, experiences 1507 mm (59 in) of rainfall annually, spread across the year with wetter summers.
In Brisbane, Australia, the annual precipitation is 979 mm (39 in), making it wetter than Sydney.
Ho Chi Minh City, Vietnam, receives 1955 mm (77 in) of annual rainfall, with a pronounced wet season from May to November, typical of its tropical monsoon climate.
Precipitation amounts are measured using specific gauges installed at weather stations, collecting both rain and snow and any other type of precipitation. Rainfall is measured directly in millimeters, while that from snow and ice is obtained by melting it. Automated systems often incorporate heaters to make this easier.
Information from these stations is transmitted via Wi-Fi, satellite, GPS, or telephone connections to central monitoring networks. This information is immediately updated and integrated into weather models and forecasts.
- "Ginger" was the longest-lasting Atlantic tropical storm, which spun around the open ocean for 28 days in 1971.
- The world's largest snowflake was recorded in the Guinness Book of Records, at 38 cm (15 inches) wide and 20 cm (7.9 inches) thick. The snowflake fell at Fort Keogh, Montana, USA, on 28 January 1887.
- The greatest snowfall recorded was on Mt. Rainier, Washington State, USA—over 31.5 meters (103 feet) fell during the winter of 1972.
For more detailed information about Santa Venerina's weather, including sunshine hours, humidity levels, and temperature data, visit our Santa Venerina Climate page.


