Riola Sardo Monthly Rainfall & Precipitation
This page shows both the average monthly rainfall and the number of rainy days in Riola Sardo, Sardinia, Italy. These values are calculated using 30 years of data (1990–2020) to ensure accuracy. Now, let's explore all the details to give you a full picture.
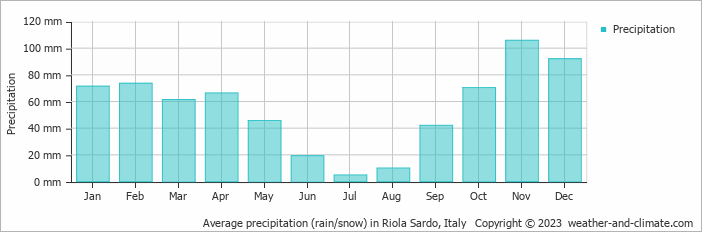
Generally, Riola Sardo receives mid-range precipitation levels, with 662 mm (26 in) annually. The distribution varies significantly throughout the year, with a distinct dry season during certain months, as shown in our charts below.
Monthly Precipitation Levels
The average number of days each month with precipitation (> 0.2 mm (0.01 in))
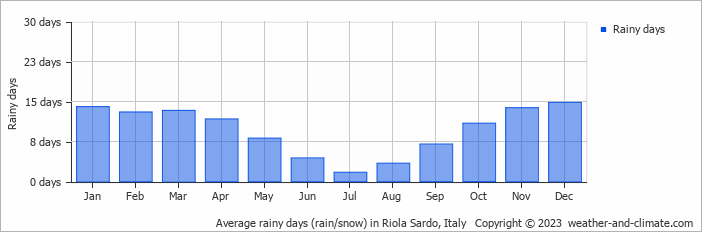
The seasons in Riola Sardo, bring significant changes in precipitation. The wettest month, November, receives high rainfall, with an average of 106 mm (4.2 in) of precipitation. This rainfall is distributed across 14 rainy days.
In contrast, the driest month, July, experiences much less rainfall, totaling 4.8 mm (0.2 in) over 2 rainy days. These distinct seasonal differences provide diverse experiences throughout the year.November, the wettest month, has a maximum daytime temperature of 19°C (66°F). The city receives 136 hours of sunshine in this period. During the driest month July you can expect a temperature of 29°C (84°F). For more detailed insights into the city's temperatures, visit our Riola Sardo Temperature page.
Annual Rainfall in Italy: City Comparison
The map below shows the annual precipitation across Italy. You can also select the different months in case you are interested in a specific month.
 heavy rainfall
 high
high
 moderate
 low
low
 almost none
Riola Sardo vs World: Rainfall Compared
Riola Sardo's average annual precipitation is 662 mm (26 in). Let's compare this to some popular worldwide tourist destinations:
Chicago, USA, sees an annual precipitation of 1062 mm (42 in), with rain and snow contributing to its humid climate.
In Seoul, South Korea, the average annual precipitation is 1237 mm (49 in), with most rain falling during the summer monsoon season.
In Tokyo, Japan, the average annual precipitation is 1528 mm (60 in), with significant summer rains due to typhoon season.
Mumbai, India, experiences a tropical monsoon climate with 1860 mm (73 in) of annual rainfall, with the majority of precipitation happening during the monsoon season from June to September.
Precipitation amounts are measured using specific gauges installed at weather stations, collecting both rain and snow and any other type of precipitation. Rainfall is measured directly in millimeters, while that from snow and ice is obtained by melting it. Automated systems often incorporate heaters to make this easier.
Information from these stations is transmitted via Wi-Fi, satellite, GPS, or telephone connections to central monitoring networks. This information is immediately updated and integrated into weather models and forecasts.
- The U.S. has a significant number of thunderstorms every year, with over 14.6 million taking place across the world annually.
- Approximately 70% of lightning bolts strike land rather than oceans.
- A storm named John was the longest-lasting Pacific tropical storm, continuing for 31 days. As it crossed the dateline twice, it changed status from a hurricane to a typhoon and back to a hurricane.
For more detailed information about Riola Sardo's weather, including sunshine hours, humidity levels, and temperature data, visit our Riola Sardo Climate page.


