Pizunda Monthly Rainfall & Precipitation
This page shows both the average monthly rainfall and the number of rainy days in Pizunda, Abkhazia, Georgia. These averages rely on historical data collected over 30 years, from 1990 to 2020. Now, let's break down all the details for a clearer picture.
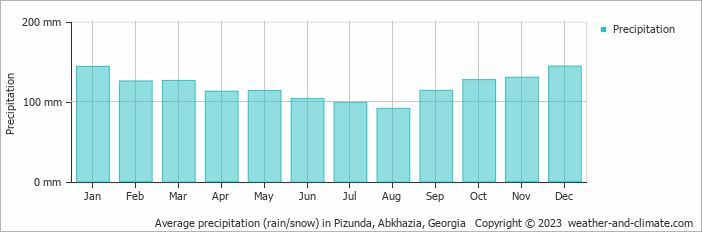
Pizunda has a notably wet climate with abundant precipitation, recording 1430 mm (56 in) of rain/snowfall per year.
Monthly Precipitation Levels
The average number of days each month with precipitation (> 0.2 mm (0.01 in))
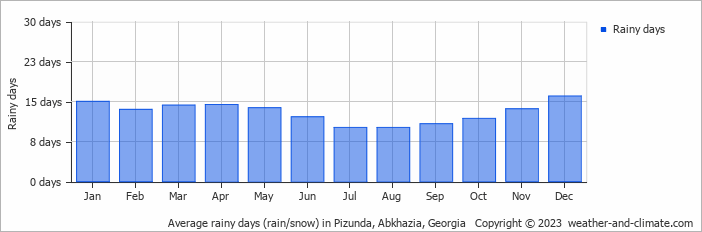
Precipitation levels in Pizunda remain relatively steady throughout the year. December has the most rain, with 144 mm (5.7 in) over 16 days. In August, this drops slightly to 91 mm (3.6 in), making the city's climate fairly predictable.
December, the wettest month, has a maximum daytime temperature of 10°C (50°F). The city receives 86 hours of sunshine in this period. During the driest month August you can expect a temperature of 27°C (81°F). For more detailed insights into the city's temperatures, visit our Pizunda Temperature page.
Daily Historical Precipitation
50-year average (1976-2025)
Average daily rainfall for each day of the month based on long-term records.
Average precipitation in July
Explore Pizunda's Historical Precipitation: 1976-2026
Browse day-by-day precipitation records for Pizunda spanning 51 years. Select any month and year to see actual rainfall and snowfall recorded on each day.
Annual Rainfall in Abkhazia, Georgia: City Comparison
The map below shows the annual precipitation across Abkhazia, Georgia. You can also select the different months in case you are interested in a specific month.
 heavy rainfall
 high
high
 moderate
 low
low
 almost none
Pizunda vs World: Rainfall Compared
Pizunda's average annual precipitation is 1430 mm (56 in). Let's compare this to some popular worldwide tourist destinations:
The city of Rome, Italy, has an average annual precipitation of 832 mm (33 in), spread fairly evenly throughout the year.
In Shanghai, China, the annual average precipitation is 1347 mm (53 in), with a humid subtropical climate.
In Brisbane, Australia, the annual precipitation is 979 mm (39 in), making it wetter than Sydney.
Bangkok, Thailand, experiences a tropical monsoon climate with 1668 mm (66 in) of annual rainfall, with the heaviest precipitation occurring during September and October.
Precipitation amounts are measured using specific gauges installed at weather stations, collecting both rain and snow and any other type of precipitation. Rainfall is measured directly in millimeters, while that from snow and ice is obtained by melting it. Automated systems often incorporate heaters to make this easier.
Information from these stations is transmitted via Wi-Fi, satellite, GPS, or telephone connections to central monitoring networks. This information is immediately updated and integrated into weather models and forecasts.
- The U.S. has a significant number of thunderstorms every year, with over 14.6 million taking place across the world annually.
- Approximately 70% of lightning bolts strike land rather than oceans.
- A storm named John was the longest-lasting Pacific tropical storm, continuing for 31 days. As it crossed the dateline twice, it changed status from a hurricane to a typhoon and back to a hurricane.
For more detailed information about Pizunda's weather, including sunshine hours, humidity levels, and temperature data, visit our Pizunda Climate page.


