Ottawa (ON) Monthly Rainfall & Precipitation
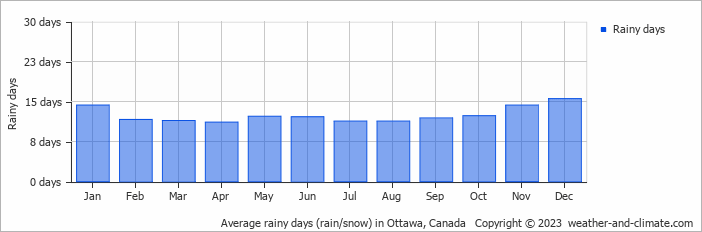
This page shows both the average monthly rainfall and the number of rainy days in Ottawa, Ontario, Canada. These averages rely on historical data collected over 30 years, from 1990 to 2020. Let's now guide you through the details for a complete overview.
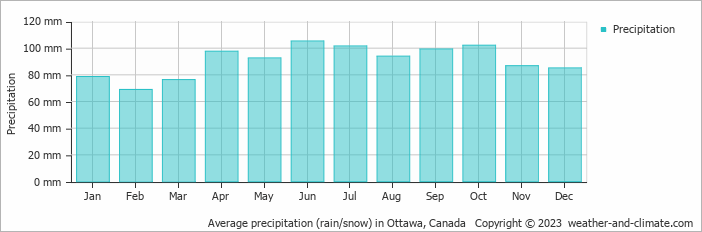
Ottawa has a relatively rain/snowy climate with high precipitation levels, averaging 1088 mm (43 in) of rain/snowfall annually.
Monthly Rainfall & Rainy Days
Monthly Precipitation Levels
The average number of days each month with precipitation (> 0.2 mm (0.01 in))
The wettest period in Ottawa occurs in June, which receives around 105 mm (4.1 in) of precipitation. During the driest month, February, Ottawa experiences moderate snowfall, totaling approximately 69 mm (2.7 in). The consistent precipitation levels throughout the year contribute to a relatively stable climate.
June, the wettest month, has a maximum daytime temperature of 25°C (77°F). The city receives 255 hours of sunshine in this period. During the driest month February you can expect a temperature of -2°C (28°F). For more detailed insights into the city's temperatures, visit our Ottawa Temperature page.
Daily Historical Precipitation
Average daily rainfall for each day of the month based on long-term records. 50-year average (1976-2025)
Average precipitation in July
Explore Ottawa's Historical Precipitation: 1976-2026
Browse day-by-day precipitation records for Ottawa spanning 51 years. Select any month and year to see actual rainfall and snowfall recorded on each day.
Annual Rainfall in Canada: City Comparison
The map below shows the annual precipitation across Canada. You can also select the different months in case you are interested in a specific month.
Ottawa vs World: Rainfall Compared
Ottawa's average annual precipitation is 1088 mm (43 in). Let's compare this to some popular worldwide tourist destinations:
Chicago, USA, sees an annual precipitation of 1062 mm (42 in), with rain and snow contributing to its humid climate.
Meanwhile, Buenos Aires, Argentina, enjoys a humid subtropical climate with 1000 mm (39 in) of annual rainfall, mostly in the summer.
In Tokyo, Japan, the average annual precipitation is 1528 mm (60 in), with significant summer rains due to typhoon season.
Ho Chi Minh City, Vietnam, receives 1955 mm (77 in) of annual rainfall, with a pronounced wet season from May to November, typical of its tropical monsoon climate.
Precipitation amounts are measured using specific gauges installed at weather stations, collecting both rain and snow and any other type of precipitation. Rainfall is measured directly in millimeters, while that from snow and ice is obtained by melting it. Automated systems often incorporate heaters to make this easier.
Information from these stations is transmitted via Wi-Fi, satellite, GPS, or telephone connections to central monitoring networks. This information is immediately updated and integrated into weather models and forecasts.
- The U.S. has a significant number of thunderstorms every year, with over 14.6 million taking place across the world annually.
- Approximately 70% of lightning bolts strike land rather than oceans.
- A storm named John was the longest-lasting Pacific tropical storm, continuing for 31 days. As it crossed the dateline twice, it changed status from a hurricane to a typhoon and back to a hurricane.
For more detailed information about Ottawa (ON)'s weather, including sunshine hours, humidity levels, and temperature data, visit our Ottawa (ON) Climate page.
Ottawa Weather by Month
Pick a month to see the average temperature, rainfall and sunshine in Ottawa - and find the best time to visit.
Ottawa 3-Day Forecast
Temperature Rainfall Sunshine Humidity
See the full Ottawa climate overview or explore weather in Canada.
Popular this month
Where to go in July - average daytime high across popular destinations.
Bucket list
Need travel inspiration? Check out our bucket list articles and be inspired.
 The 5 most beautiful lakes in Canada
Explore Canada's stunning lakes: Lake Louise, Lake Superior, Maligne Lake, Emerald Lake, and Lake Okanagan, each offering unique beauty and activities.
Canoeing the south Nahannii
The South Nahanni in the northwest of Canada is one of the most impressive wilderness rivers in the world. Canoeing the south Nahanni is something you must add to your bucket list.
See Polar Bears in Churchill Canada
Thousands of bears gather at the small town of Churchill. In the evening the northern lights give a light show against the dark evening sky. An unforgettable experience.
Banff National Park
Snowy mountains, clear blue lakes and green forests make Banff National Park a wonderful bucket list destination. The pristine wilderness is a mecca for walkers.