




















 The 10 most charming villages in France
Discover France's top 10 beautiful villages. From Normandy to the Côte d'Azur, experience quaint squares and cobbled streets. Which one will you visit this summer?
This page shows both the average monthly rainfall and the number of rainy days in Nort-sur-Erdre, Pays de la Loire, France. The numbers reflect climate data gathered over a 30-year period, from 1990 to 2020. Let's now guide you through the details for a complete overview.
Generally, Nort-sur-Erdre experiences moderate precipitation patterns, averaging 763 mm (30 in) yearly.
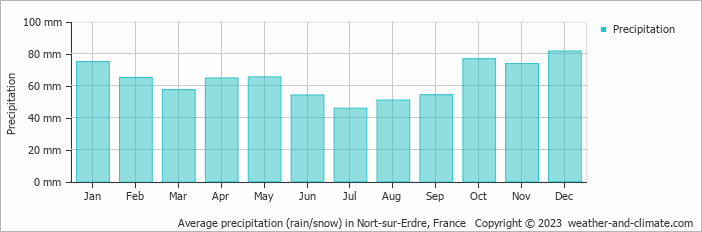
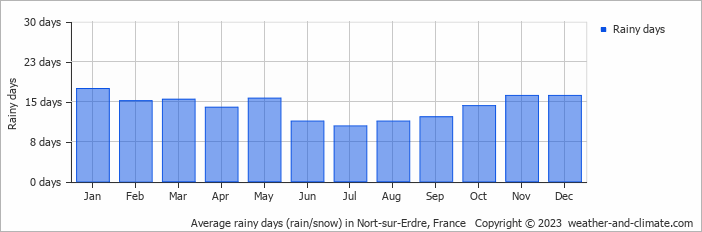
While rainfall varies throughout the year, each season offers its own charm. December brings wetter days averaging 81 mm (3.2 in) of precipitation, spread over 16 rainy days.
In contrast, July experiences a drier climate, with about 46 mm (1.8 in) of rainfall spread across 10 rainy days.
December, the wettest month, has a maximum daytime temperature of 11°C (52°F). The city receives 77 hours of sunshine in this period. During the driest month July you can expect a temperature of 25°C (77°F). For more detailed insights into the city's temperatures, visit our Nort-sur-Erdre Temperature page.
The map below shows the annual precipitation across France. You can also select the different months in case you are interested in a specific month.
Nort-sur-Erdre's average annual precipitation is 763 mm (30 in). Let's compare this to some popular worldwide tourist destinations:
In Barcelona, Spain, the average annual precipitation is 620 mm (24 in), evenly distributed across the year with no extreme wet or dry seasons.
Meanwhile, Buenos Aires, Argentina, enjoys a humid subtropical climate with 1000 mm (39 in) of annual rainfall, mostly in the summer.
Adelaide, Australia, enjoys 511 mm (20 in) of annual precipitation, with dry summers and wet winters.
Kuala Lumpur, Malaysia, receives 2529 mm (100 in) of annual rainfall, characteristic of its equatorial tropical rainforest climate, with consistent rainfall throughout the year and peak months during March and November.
Precipitation amounts are measured using specific gauges installed at weather stations, collecting both rain and snow and any other type of precipitation. Rainfall is measured directly in millimeters, while that from snow and ice is obtained by melting it. Automated systems often incorporate heaters to make this easier.
Information from these stations is transmitted via Wi-Fi, satellite, GPS, or telephone connections to central monitoring networks. This information is immediately updated and integrated into weather models and forecasts.
For more detailed information about Nort-sur-Erdre's weather, including sunshine hours, humidity levels, and temperature data, visit our Nort-sur-Erdre Climate page.
Pick a month to see the average temperature, rainfall and sunshine in Nort-sur-Erdre - and find the best time to visit.
Temperature Rainfall Sunshine Humidity
See the full Nort-sur-Erdre climate overview or explore weather in France.
Where to go in September - average daytime high across popular destinations.
Need travel inspiration? Check out our bucket list articles and be inspired.
The 10 most charming villages in France
Discover France's top 10 beautiful villages. From Normandy to the Côte d'Azur, experience quaint squares and cobbled streets. Which one will you visit this summer?
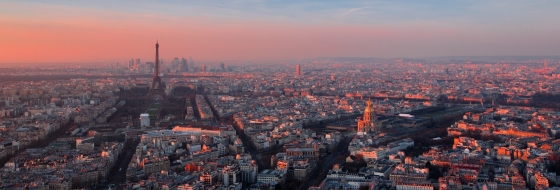 An alternative way to discover Paris
From street art, vintage shops, vegetarian cafes, to amazing cultural events, Paris has much to offer for the creative traveler. An overview of sights that you must see if you want to visit this city in an alternative way.
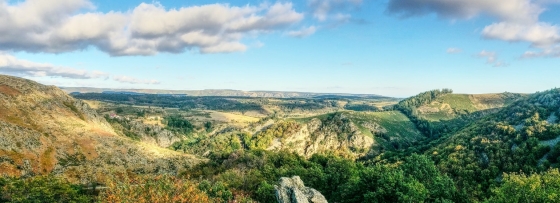 Nature is allowed to take its course in the Ardeche
The Ardèche is France at its most beautiful. The authentic villages and breathtaking mountainous landscapes are one of the main reasons. he climate in Ardèche is very pleasant. Temperatures are high during summer and it is often very sunny.

 Explore the natural wonders of Corsica
Corsica offers an abundance of incredible natural wonders to explore. This stunning Mediterranean island is a paradise for outdoor enthusiasts and nature lovers alike.