Muriaé Monthly Rainfall & Precipitation
This page shows both the average monthly rainfall and the number of rainy days in Muriaé, Minas Gerais, Brazil. These values are calculated using 30 years of data (1990–2020) to ensure accuracy. Now, let's break down all the details for a clearer picture.
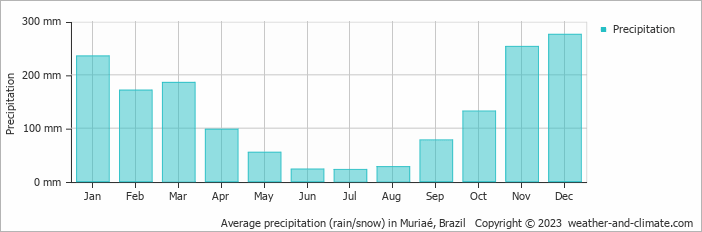
Muriaé has a relatively rainy climate with high precipitation levels, averaging 1556 mm (61 in) of rainfall annually. Despite the high annual total, it does experience a distinct dry and rainy season during certain months. Examine our detailed charts below to understand these seasonal patterns.
Monthly Rainfall & Rainy Days
Monthly Precipitation Levels
The average number of days each month with precipitation (> 0.2 mm (0.01 in))
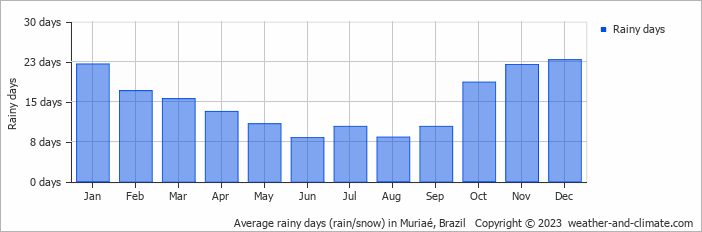
Significant seasonal changes in precipitation occur throughout the year. During the wettest month, December receives substantial rainfall, averaging 276 mm (11 in) of precipitation, recorded across 23 rainy days.
In contrast, the driest month, July brings less rainfall, with 22 mm (0.9 in) over 10 rainy days.
December, the wettest month, has a maximum daytime temperature of 31°C (88°F). The city receives 179 hours of sunshine in this period. During the driest month July you can expect a temperature of 26°C (79°F). For more detailed insights into the city's temperatures, visit our Muriaé Temperature page.
Annual Rainfall in Brazil: City Comparison
The map below shows the annual precipitation across Brazil. You can also select the different months in case you are interested in a specific month.
Muriaé vs World: Rainfall Compared
Muriaé's average annual precipitation is 1556 mm (61 in). Let's compare this to some popular worldwide tourist destinations:
The climate in San Francisco, USA, is influenced by coastal weather, with 469 mm (18 in) of rainfall mostly during the winter months.
In Seoul, South Korea, the average annual precipitation is 1237 mm (49 in), with most rain falling during the summer monsoon season.
Adelaide, Australia, enjoys 511 mm (20 in) of annual precipitation, with dry summers and wet winters.
Ho Chi Minh City, Vietnam, receives 1955 mm (77 in) of annual rainfall, with a pronounced wet season from May to November, typical of its tropical monsoon climate.
Precipitation amounts are measured using specific gauges installed at weather stations, collecting both rain and snow and any other type of precipitation. Rainfall is measured directly in millimeters, while that from snow and ice is obtained by melting it. Automated systems often incorporate heaters to make this easier.
Information from these stations is transmitted via Wi-Fi, satellite, GPS, or telephone connections to central monitoring networks. This information is immediately updated and integrated into weather models and forecasts.
Climate change is affecting precipitation patterns worldwide, including Muriaé:
- Changing Rainfall Patterns: Global warming causes drastic changes in the patterns of rainfall. Some areas have been experiencing increased frequency and intensity of rainfall, while other areas experience longer dry spells or even droughts.
- Local Impacts: Many regions are experiencing heavier rainfall in the winter months and drier, hotter summers. This affects agriculture, water resources, and ecosystems.
- Mawsynram in India is noted as being the wettest place on earth, with over 11 meters (36 feet) of rain falling every year.
- In contrast, Antofagasta in Chile is among the driest places on the planet, getting less than 0.1mm (0.004 inches) per year, with some years recording virtually no rainfall.
- Nearly 1,650 thunderstorm cells are estimated over the planet at any given time.
For more detailed information about Muriaé's weather, including sunshine hours, humidity levels, and temperature data, visit our Muriaé Climate page.
Muriaé Weather by Month
Pick a month to see the average temperature, rainfall and sunshine in Muriaé - and find the best time to visit.
Muriaé 3-Day Forecast
Temperature Rainfall Sunshine Humidity
See the full Muriaé climate overview or explore weather in Brazil.
Popular this month
Where to go in July - average daytime high across popular destinations.
Bucket list
Need travel inspiration? Check out our bucket list articles and be inspired.
 The 10 most alternative cities in South America
Discover South America's top 10 alternative cities! From Valparaíso's vibrant streets to La Paz's high-altitude charm and Medellín's innovative spirit.
 The 5 most tranquil retreats in the Amazon Rainforest, Brazil
Discover top sustainable lodges in the Amazon. Enjoy unique wildlife, eco-friendly stays, and immersive experiences at Anavilhanas, Cristalino, and more.
An alternative way to discover Rio de Janeiro
Don't feel like seeing the traditional tourist sights in Rio de Janeiro? We have made an overview of the sights in Rio de Janeiro that you must see if you want to visit Rio in an alternative way.
Iguazu Falls
Iguazu Falls are among the largest waterfalls on earth. You will be speechless when you see this miracle of mother nature. They are included in the World Heritage List and have also been named one of the seven wonders of the world.