Murat Precipitation: Average Monthly Rainfall and Snowfall
This graph shows the average amount of rainfall per month in Murat (Auvergne). The numbers are calculated over a 30-year period to provide a reliable average.
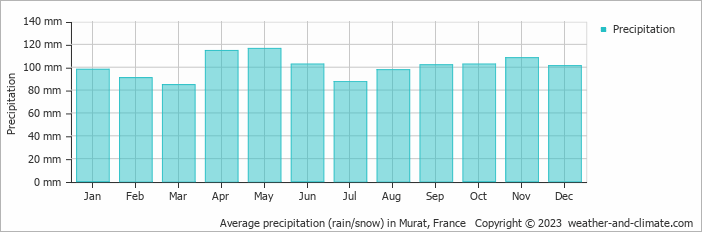
- A lot of rain (rainy season) falls in the months: April, May, June, September, October, November and December.
- On average, May is the wettest month with 116 mm of precipitation.
- On average, March is the driest month with 85 mm of precipitation.
- The average amount of annual precipitation is 1206 mm.
Current rainfall in Murat
Wed Nov 27
11°C | 0°C
SW  7 km/h
7 km/halmost clear and no rain
Thu Nov 28
12°C | 3°C
W 7 km/h
7 km/hpartly cloudy and no rain
Fri Nov 29
11°C | 3°C
E 4 km/h
4 km/halmost clear and no rain