Monte Sião Monthly Rainfall & Precipitation
This page shows both the average monthly rainfall and the number of rainy days in Monte Sião, Minas Gerais, Brazil. The numbers reflect climate data gathered over a 30-year period, from 1990 to 2020. Now, let's break down all the details for a clearer picture.
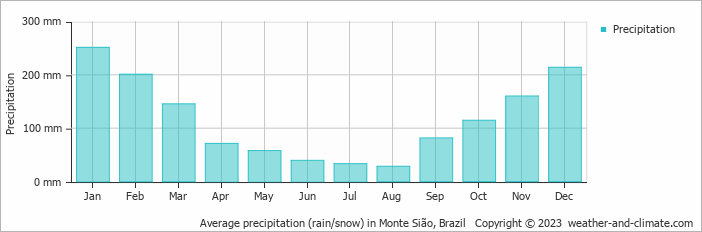
Monte Sião has a relatively rainy climate with high precipitation levels, averaging 1397 mm (55 in) of rainfall annually. Despite the high annual total, it does experience a distinct dry and rainy season during certain months. Examine our detailed charts below to understand these seasonal patterns.
Monthly Rainfall & Rainy Days
Monthly Precipitation Levels
The average number of days each month with precipitation (> 0.2 mm (0.01 in))
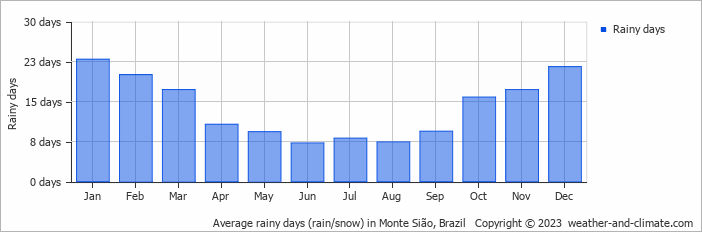
Significant seasonal changes in precipitation occur throughout the year. During the wettest month, January receives substantial rainfall, averaging 251 mm (9.9 in) of precipitation, recorded across 23 rainy days.
In contrast, the driest month, August brings less rainfall, with 28 mm (1.1 in) over 7 rainy days.
January, the wettest month, has a maximum daytime temperature of 29°C (84°F). The city receives 217 hours of sunshine in this period. During the driest month August you can expect a temperature of 27°C (81°F). For more detailed insights into the city's temperatures, visit our Monte Sião Temperature page.
Annual Rainfall in Brazil: City Comparison
The map below shows the annual precipitation across Brazil. You can also select the different months in case you are interested in a specific month.
Monte Sião vs World: Rainfall Compared
Monte Sião's average annual precipitation is 1397 mm (55 in). Let's compare this to some popular worldwide tourist destinations:
In Barcelona, Spain, the average annual precipitation is 620 mm (24 in), evenly distributed across the year with no extreme wet or dry seasons.
Beijing, China, receives 560 mm (22 in) of annual precipitation, concentrated in the summer months.
In Brisbane, Australia, the annual precipitation is 979 mm (39 in), making it wetter than Sydney.
Singapore, situated near the equator, gets 2581 mm (102 in) of rainfall annually, with no distinct dry season and consistent monthly precipitation.
Precipitation amounts are measured using specific gauges installed at weather stations, collecting both rain and snow and any other type of precipitation. Rainfall is measured directly in millimeters, while that from snow and ice is obtained by melting it. Automated systems often incorporate heaters to make this easier.
Information from these stations is transmitted via Wi-Fi, satellite, GPS, or telephone connections to central monitoring networks. This information is immediately updated and integrated into weather models and forecasts.
The proximity of a location to a large body of water can significantly affect its rainfall patterns:
- Ocean Influence: Coastal regions typically receive more rainfall due to the presence of moisture-laden winds from the ocean. These regions tend to have more humid climates and experience more frequent precipitation, especially in winter.
- Continental Climates: Areas further from the sea, such as inland or continental regions, experience less frequent rainfall and more extreme seasonal variations in precipitation.
- The U.S. has a significant number of thunderstorms every year, with over 14.6 million taking place across the world annually.
- Approximately 70% of lightning bolts strike land rather than oceans.
- A storm named John was the longest-lasting Pacific tropical storm, continuing for 31 days. As it crossed the dateline twice, it changed status from a hurricane to a typhoon and back to a hurricane.
For more detailed information about Monte Sião's weather, including sunshine hours, humidity levels, and temperature data, visit our Monte Sião Climate page.
Monte Sião Weather by Month
Pick a month to see the average temperature, rainfall and sunshine in Monte Sião - and find the best time to visit.
Monte Sião 3-Day Forecast
Temperature Rainfall Sunshine Humidity
See the full Monte Sião climate overview or explore weather in Brazil.
Popular this month
Where to go in July - average daytime high across popular destinations.
Bucket list
Need travel inspiration? Check out our bucket list articles and be inspired.
 The 10 most alternative cities in South America
Discover South America's top 10 alternative cities! From Valparaíso's vibrant streets to La Paz's high-altitude charm and Medellín's innovative spirit.
 The 5 most tranquil retreats in the Amazon Rainforest, Brazil
Discover top sustainable lodges in the Amazon. Enjoy unique wildlife, eco-friendly stays, and immersive experiences at Anavilhanas, Cristalino, and more.
An alternative way to discover Rio de Janeiro
Don't feel like seeing the traditional tourist sights in Rio de Janeiro? We have made an overview of the sights in Rio de Janeiro that you must see if you want to visit Rio in an alternative way.
Iguazu Falls
Iguazu Falls are among the largest waterfalls on earth. You will be speechless when you see this miracle of mother nature. They are included in the World Heritage List and have also been named one of the seven wonders of the world.