Los Naranjos Monthly Rainfall & Precipitation
This page shows both the average monthly rainfall and the number of rainy days in Los Naranjos, Colombia. This average is based on long-term data collected between 1990 and 2020. Now, let's explore all the details to give you a full picture.
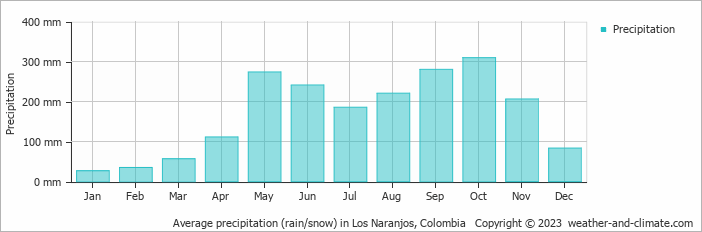
Los Naranjos is known for its substantial rainfall, with annual precipitation reaching 2026 mm (80 in). While the overall climate is wet, there are notable seasonal patterns that create interesting contrasts, as demonstrated in our graph below.
Monthly Rainfall & Rainy Days
Monthly Precipitation Levels
The average number of days each month with precipitation (> 0.2 mm (0.01 in))
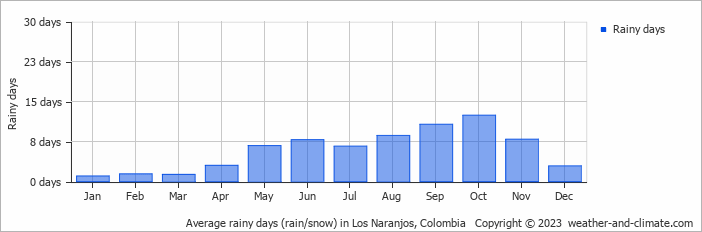
Los Naranjos can be quite wet during October, receiving approximately 309 mm (12 in) of precipitation over 12 rainy days.
In contrast January, experiences much drier conditions, with 26 mm (1 in) of rainfall, spread across a single rainy day.
October, the wettest month, has a maximum daytime temperature of 28°C (82°F). The city receives 156 hours of sunshine in this period. During the driest month January you can expect a temperature of 27°C (81°F). For more detailed insights into the city's temperatures, visit our Los Naranjos Temperature page.
Annual Rainfall in Colombia: City Comparison
The map below shows the annual precipitation across Colombia. You can also select the different months in case you are interested in a specific month.
Los Naranjos vs World: Rainfall Compared
Los Naranjos's average annual precipitation is 2026 mm (80 in). Let's compare this to some popular worldwide tourist destinations:
In Barcelona, Spain, the average annual precipitation is 620 mm (24 in), evenly distributed across the year with no extreme wet or dry seasons.
In Shanghai, China, the annual average precipitation is 1347 mm (53 in), with a humid subtropical climate.
In Brisbane, Australia, the annual precipitation is 979 mm (39 in), making it wetter than Sydney.
Ho Chi Minh City, Vietnam, receives 1955 mm (77 in) of annual rainfall, with a pronounced wet season from May to November, typical of its tropical monsoon climate.
Precipitation amounts are measured using specific gauges installed at weather stations, collecting both rain and snow and any other type of precipitation. Rainfall is measured directly in millimeters, while that from snow and ice is obtained by melting it. Automated systems often incorporate heaters to make this easier.
Information from these stations is transmitted via Wi-Fi, satellite, GPS, or telephone connections to central monitoring networks. This information is immediately updated and integrated into weather models and forecasts.
The proximity of a location to a large body of water can significantly affect its rainfall patterns:
- Ocean Influence: Coastal regions typically receive more rainfall due to the presence of moisture-laden winds from the ocean. These regions tend to have more humid climates and experience more frequent precipitation, especially in winter.
- Continental Climates: Areas further from the sea, such as inland or continental regions, experience less frequent rainfall and more extreme seasonal variations in precipitation.
- "Ginger" was the longest-lasting Atlantic tropical storm, which spun around the open ocean for 28 days in 1971.
- The world's largest snowflake was recorded in the Guinness Book of Records, at 38 cm (15 inches) wide and 20 cm (7.9 inches) thick. The snowflake fell at Fort Keogh, Montana, USA, on 28 January 1887.
- The greatest snowfall recorded was on Mt. Rainier, Washington State, USA, over 31.5 meters (103 feet) fell during the winter of 1972.
For more detailed information about Los Naranjos's weather, including sunshine hours, humidity levels, and temperature data, visit our Los Naranjos Climate page.
Los Naranjos Weather by Month
Pick a month to see the average temperature, rainfall and sunshine in Los Naranjos - and find the best time to visit.


Los Naranjos 3-Day Forecast
Temperature Rainfall Sunshine Humidity
See the full Los Naranjos climate overview or explore weather in Colombia.
Popular this month
Where to go in September - average daytime high across popular destinations.
 Cartagena
 31°C (88°F) Santa Marta29°C (84°F) San Andrés30°C (86°F) Cali27°C (81°F) Medellín25°C (77°F) Pereira24°C (75°F) Bogotá
 21°C (70°F) Villa de Leyva
 21°C (70°F)














Bucket list
Need travel inspiration? Check out our bucket list articles and be inspired.
 The 10 most alternative cities in South America
Discover South America's top 10 alternative cities! From Valparaíso's vibrant streets to La Paz's high-altitude charm and Medellín's innovative spirit.
5 Hidden Gems in Colombia
Explore Colombia's hidden gems, from El Cocuy's remote beauty to Providencia's serene beaches, offering authentic experiences off the beaten path.
Tayrona National Park: the most beautiful part of Colombia
Visit the park between the months December and March (not February since it is closed) or from June till August (this is high season).
Breathtaking view in Minca
Minca is a tiny village in the tropical rain forest of Colombia and is an oasis of tranquility. Everyone looking for a relatively undiscovered piece of Colombia is in the right place here.