Los Naranjos Weather & Climate: Best Time to Visit
Average temperatures, rainfall, sunshine and the best time to visit Los Naranjos.
Climate overview of Los Naranjos
The climate in Los Naranjos, Colombia, is remarkably consistent, with temperatures year-round averaging 28°C (82°F). The warmest month is June at 28°C (82°F), and the coolest is February at 27°C (81°F).
Rainfall is high, totalling around 2026 mm (80 in) per year. October is the wettest month and January the driest. The city also experiences distinct dry (January to February) and wet (May to November) seasons. January is the sunniest month, averaging 6.9 hours of sunshine per day.
Los Naranjos Weather by Month
Pick a month to see the average temperature, rainfall and sunshine in Los Naranjos - and find the best time to visit.
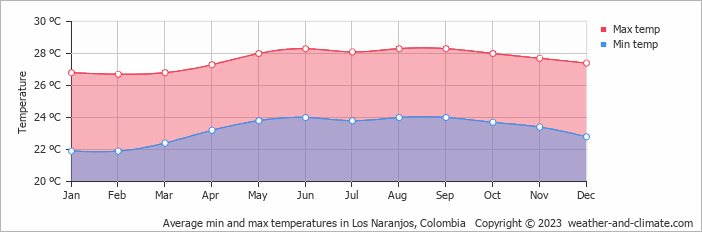
Monthly Temperature in Los Naranjos
In Los Naranjos temperatures are generally consistent throughout the year. Average maximum daytime temperatures range from a comfortable 28°C (82°F) in June, the warmest time of the year, to a comfortable 27°C (81°F) during cooler months like February.
At night, you can expect temperatures ranging from 24°C (75°F) in June to around 22°C (72°F) during February.
Check out our detailed temperature page for more information.
Temperature ranges by month
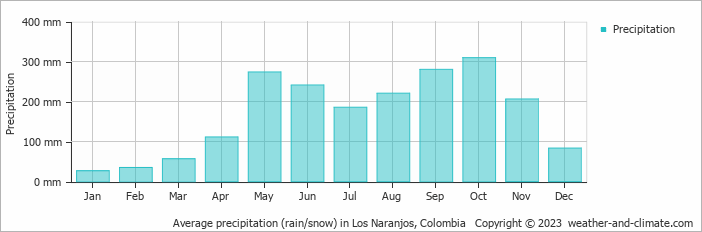
Rainfall in Los Naranjos
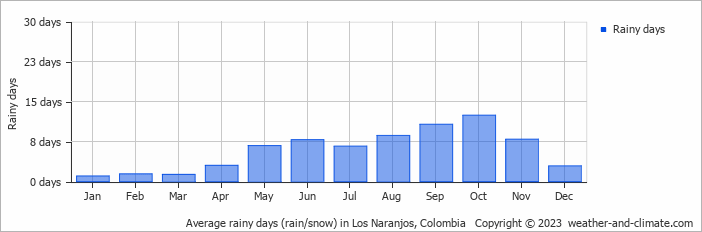
Los Naranjos experiences significant rainfall throughout the year, averaging 2026 mm (80 in) of precipitation annually. Significant seasonal changes in precipitation occur throughout the year. In the wettest month, October it receives heavy rainfall, averaging 309 mm (12 in) of precipitation, recorded across 12 rainy days. In contrast, the driest month January brings less rainfall, with 26 mm (1 in) over a single rainy day. For more details, please visit our Los Naranjos Precipitation page.
The mean monthly precipitation over the year, including rain, hail, and snow
The average number of days each month with precipitation
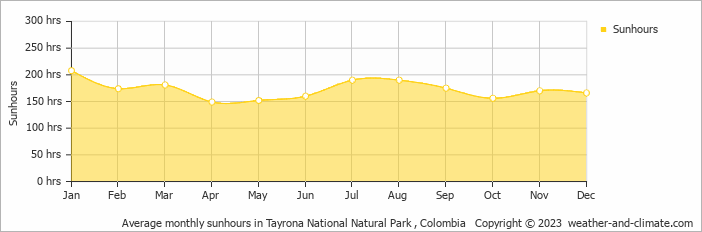
Sunshine Hours in Los Naranjos
While the amount of sunshine in Los Naranjos varies throughout the year, all seasons offer their own charm. Enjoy up to 6.9 hours of daily sun in January, and experience slightly darker atmosphere in April, with about 5.0 hours of daily sunlight.
Visit our detailed sunshine hours page for more information.
Monthly hours of sunshine
Daily hours of sunshine
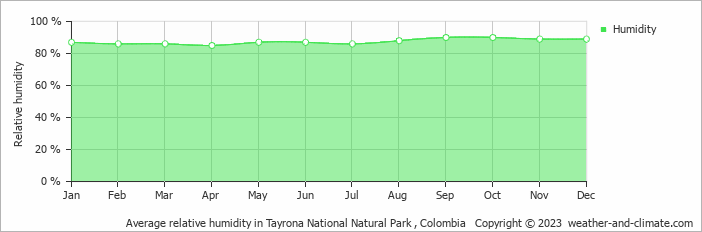
Humidity in Los Naranjos by Month
The city experiences its highest humidity in September, reaching 90%. In April, the humidity drops to its lowest level at 85%. What does this mean? Read our detailed page on humidity levels for further details.
Relative humidity over the year
Best Time to Visit Los Naranjos
Monthly ratings reflect general weather comfort, based on daytime temperature and rainfall. Swimming and winter conditions are highlighted separately where relevant.
- Best overall: January, February, March and December
- Warmest weather: all year round
- Most sunshine: January
- Fewer rainy days: January, February, March, April and December
- Seasonal pattern: Distinct dry (January to February) and wet (May to November) seasons
Frequently asked questions about the climate in Los Naranjos
What is the best time to visit Los Naranjos?
January, February, March and December typically offer the most optimal weather in Los Naranjos. In contrast, May, September and October tend to have less optimal conditions. Los Naranjos has distinct dry (January to February) and wet (May to November) seasons.
What temperatures can I expect in Los Naranjos?
Daytime highs range from 27°C (81°F) in February to 28°C (82°F) in June. Nighttime lows range from 22°C (72°F) to 24°C (75°F). Temperatures stay relatively stable year-round.
How much rain does Los Naranjos get?
Annual rainfall is around 2026 mm (80 in). October is the wettest month with 309 mm (12 in), while January is the driest with 26 mm (1 in).
How sunny is Los Naranjos?
Los Naranjos receives around 2,071 hours of sunshine per year. January is the sunniest month with 208 hours, while April is the cloudiest with just 149 hours. Overall, Los Naranjos enjoys abundant sunshine.
Los Naranjos 3-Day Forecast
Los Naranjos on the map
Los Naranjos is highlighted - select any city to see its climate.
Popular this month
Where to go in July - average daytime high across popular destinations.
Bucket list
Need travel inspiration? Check out our bucket list articles and be inspired.
 The 10 most alternative cities in South America
Discover South America's top 10 alternative cities! From Valparaíso's vibrant streets to La Paz's high-altitude charm and Medellín's innovative spirit.
 5 Hidden Gems in Colombia
Explore Colombia's hidden gems, from El Cocuy's remote beauty to Providencia's serene beaches, offering authentic experiences off the beaten path.
Tayrona National Park: the most beautiful part of Colombia
Visit the park between the months December and March (not February since it is closed) or from June till August (this is high season).
Breathtaking view in Minca
Minca is a tiny village in the tropical rain forest of Colombia and is an oasis of tranquility. Everyone looking for a relatively undiscovered piece of Colombia is in the right place here.