Lake Louise (AB) Monthly Rainfall & Precipitation
This page shows both the average monthly rainfall and the number of rainy days in Lake Louise, Alberta, Canada. These values are calculated using 30 years of data (1990–2020) to ensure accuracy. Now, let's explore all the details to give you a full picture.
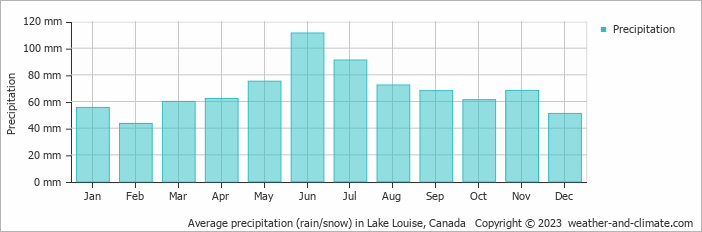
Generally, Lake Louise receives mid-range precipitation levels, with 819 mm (32 in) annually.
Monthly Rainfall & Rainy Days
Monthly Precipitation Levels
The average number of days each month with precipitation (> 0.2 mm (0.01 in))
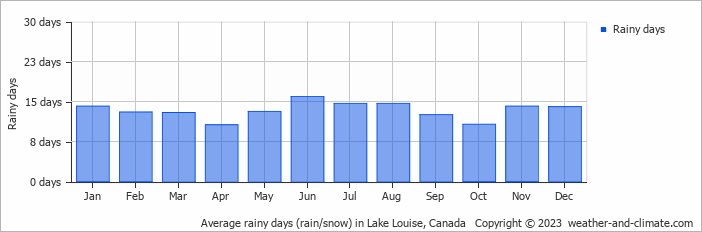
The seasons in Lake Louise, bring significant changes in precipitation. The wettest month, June, receives high rainfall, with an average of 111 mm (4.4 in) of precipitation. This rainfall is distributed across 16 rainy days.
In contrast, the driest month, February, experiences much less snowfall, totaling 43 mm (1.7 in) over 13 snowy days. These distinct seasonal differences provide diverse experiences throughout the year.June, the wettest month, has a maximum daytime temperature of 11°C (52°F). The city receives 209 hours of sunshine in this period. During the driest month February you can expect a temperature of -8°C (18°F). For more detailed insights into the city's temperatures, visit our Lake Louise Temperature page.
Daily Historical Precipitation
Average daily rainfall for each day of the month based on long-term records. 50-year average (1976-2025)
Average precipitation in August
Explore Lake Louise's Historical Precipitation: 1976-2026
Browse day-by-day precipitation records for Lake Louise spanning 51 years. Select any month and year to see actual rainfall and snowfall recorded on each day.
Annual Rainfall in Canada: City Comparison
The map below shows the annual precipitation across Canada. You can also select the different months in case you are interested in a specific month.
Lake Louise vs World: Rainfall Compared
Lake Louise's average annual precipitation is 819 mm (32 in). Let's compare this to some popular worldwide tourist destinations:
The climate in San Francisco, USA, is influenced by coastal weather, with 469 mm (18 in) of rainfall mostly during the winter months.
Osaka, Japan, experiences 1507 mm (59 in) of rainfall annually, spread across the year with wetter summers.
In Brisbane, Australia, the annual precipitation is 979 mm (39 in), making it wetter than Sydney.
Ho Chi Minh City, Vietnam, receives 1955 mm (77 in) of annual rainfall, with a pronounced wet season from May to November, typical of its tropical monsoon climate.
Precipitation amounts are measured using specific gauges installed at weather stations, collecting both rain and snow and any other type of precipitation. Rainfall is measured directly in millimeters, while that from snow and ice is obtained by melting it. Automated systems often incorporate heaters to make this easier.
Information from these stations is transmitted via Wi-Fi, satellite, GPS, or telephone connections to central monitoring networks. This information is immediately updated and integrated into weather models and forecasts.
Tropical Rainforests: In tropical regions, rainfall is generally abundant year-round. Areas near the equator, like the Amazon rainforest, can receive up to 3000 mm (118 in) of rain annually.
Desert Regions: Deserts such as the Sahara and Arabian deserts typically see less than 250 mm (9.8 in) of rainfall annually. Rainfall tends to be infrequent, but when it does occur, it is often intense.
Temperate Zones: In temperate regions, precipitation tends to be more evenly distributed, though areas closer to the ocean may see more rain in the winter months, and areas further inland experience drier summers.
Polar Regions: Precipitation in polar regions, like Antarctica, is extremely low, often falling as snow. Average annual precipitation in Antarctica is less than 200 mm (7.9 in), with some areas receiving as little as 50 mm (2 in) annually.
- The U.S. has a significant number of thunderstorms every year, with over 14.6 million taking place across the world annually.
- Approximately 70% of lightning bolts strike land rather than oceans.
- A storm named John was the longest-lasting Pacific tropical storm, continuing for 31 days. As it crossed the dateline twice, it changed status from a hurricane to a typhoon and back to a hurricane.
For more detailed information about Lake Louise (AB)'s weather, including sunshine hours, humidity levels, and temperature data, visit our Lake Louise (AB) Climate page.
Lake Louise Weather by Month
Pick a month to see the average temperature, rainfall and sunshine in Lake Louise - and find the best time to visit.
Lake Louise 3-Day Forecast
Temperature Rainfall Sunshine Humidity
See the full Lake Louise climate overview or explore weather in Canada.
Popular this month
Where to go in August - average daytime high across popular destinations.
Bucket list
Need travel inspiration? Check out our bucket list articles and be inspired.
 The 5 most beautiful lakes in Canada
Explore Canada's stunning lakes: Lake Louise, Lake Superior, Maligne Lake, Emerald Lake, and Lake Okanagan, each offering unique beauty and activities.
Canoeing the south Nahannii
The South Nahanni in the northwest of Canada is one of the most impressive wilderness rivers in the world. Canoeing the south Nahanni is something you must add to your bucket list.
See Polar Bears in Churchill Canada
Thousands of bears gather at the small town of Churchill. In the evening the northern lights give a light show against the dark evening sky. An unforgettable experience.
Banff National Park
Snowy mountains, clear blue lakes and green forests make Banff National Park a wonderful bucket list destination. The pristine wilderness is a mecca for walkers.