Ha Long Monthly Rainfall & Precipitation
This page shows both the average monthly rainfall and the number of rainy days in Ha Long, Quang Ninh, Vietnam. The figures are based on a 30-year period (1990–2020) to provide a reliable average. Let's now guide you through the details for a complete overview.
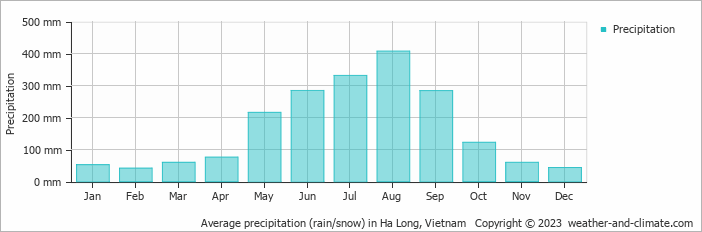
Ha Long has a relatively rainy climate with high precipitation levels, averaging 1974 mm (78 in) of rainfall annually. Despite the high annual total, it does experience a distinct rainy season during certain months. Examine our detailed charts below to understand these seasonal patterns.
Monthly Rainfall & Rainy Days
Monthly Precipitation Levels
The average number of days each month with precipitation (> 0.2 mm (0.01 in))
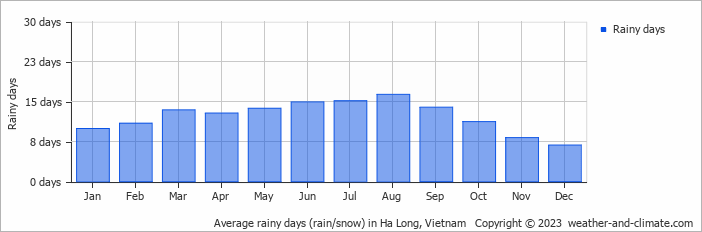
The climate in Ha Long shows significant variation throughout the year. Expect 407 mm (16 in) of precipitation during the wettest month August, distributed over 16 rainy days.
In contrast, February offers drier and sunnier days, with around 41 mm (1.6 in) of rainfall over 11 rainy days.
August, the wettest month, has a maximum daytime temperature of 32°C (90°F). The city receives 175 hours of sunshine in this period. During the driest month February you can expect a temperature of 21°C (70°F). For more detailed insights into the city's temperatures, visit our Ha Long Temperature page.
Daily Historical Precipitation
Average daily rainfall for each day of the month based on long-term records. 50-year average (1976-2025)
Average precipitation in July
Explore Ha Long's Historical Precipitation: 1976-2026
Browse day-by-day precipitation records for Ha Long spanning 51 years. Select any month and year to see actual rainfall and snowfall recorded on each day.
Annual Rainfall in Vietnam: City Comparison
The map below shows the annual precipitation across Vietnam. You can also select the different months in case you are interested in a specific month.
Ha Long vs World: Rainfall Compared
Ha Long's average annual precipitation is 1974 mm (78 in). Let's compare this to some popular worldwide tourist destinations:
In Barcelona, Spain, the average annual precipitation is 644 mm (25 in), evenly distributed across the year with no extreme wet or dry seasons.
Beijing, China, receives 560 mm (22 in) of annual precipitation, concentrated in the summer months.
Melbourne, Australia, has 690 mm (27 in) of rainfall annually, spread fairly evenly throughout the year.
Ho Chi Minh City, Vietnam, receives 1955 mm (77 in) of annual rainfall, with a pronounced wet season from May to November, typical of its tropical monsoon climate.
Precipitation amounts are measured using specific gauges installed at weather stations, collecting both rain and snow and any other type of precipitation. Rainfall is measured directly in millimeters, while that from snow and ice is obtained by melting it. Automated systems often incorporate heaters to make this easier.
Information from these stations is transmitted via Wi-Fi, satellite, GPS, or telephone connections to central monitoring networks. This information is immediately updated and integrated into weather models and forecasts.
- Mawsynram in India is noted as being the wettest place on earth, with over 11 meters (36 feet) of rain falling every year.
- In contrast, Antofagasta in Chile is among the driest places on the planet, getting less than 0.1mm (0.004 inches) per year, with some years recording virtually no rainfall.
- Nearly 1,650 thunderstorm cells are estimated over the planet at any given time.
For more detailed information about Ha Long's weather, including sunshine hours, humidity levels, and temperature data, visit our Ha Long Climate page.
Ha Long Weather by Month
Pick a month to see the average temperature, rainfall and sunshine in Ha Long - and find the best time to visit.
Ha Long 3-Day Forecast
Temperature Rainfall Sunshine Humidity
See the full Ha Long climate overview or explore weather in Vietnam.
Popular this month
Where to go in July - average daytime high across popular destinations.
Bucket list
Need travel inspiration? Check out our bucket list articles and be inspired.
 Visit Sapa in Vietnam
Balancing on the edges of a rice field with endless views. A trek through the valley of Sapa is definitely a must for the bucket list.
Peace, beauty and silence in Vietnam
Vedana is located along the shores of a secluded, peaceful and serene lagoon, surrounded in lushly forested peaks. This ensures an isolated appeal and stunning views across a vast immense lagoon.