Guarda Monthly Rainfall & Precipitation
This page shows both the average monthly rainfall and the number of rainy days in Guarda, Beiras region, Portugal. The figures are based on a 30-year period (1990–2020) to provide a reliable average. Let's explore the details to provide you with a complete overview.
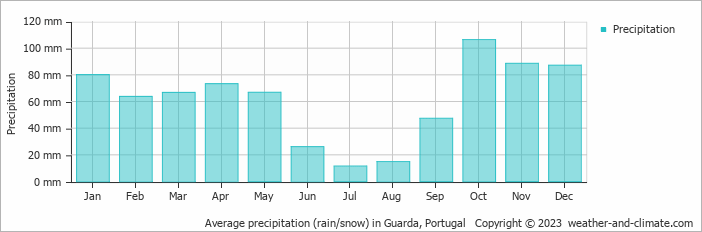
Generally, Guarda has a moderate amount of precipitation, averaging 732 mm (29 in) of rain/snowfall annually. However, it does experience a distinct dry season during certain months. Take a look at our detailed charts below to see the seasonal variation.
Monthly Precipitation Levels
The average number of days each month with precipitation (> 0.2 mm (0.01 in))
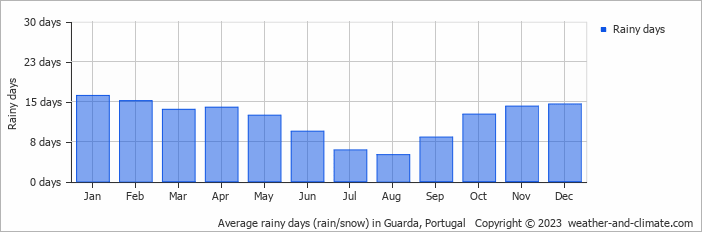
Guarda can be quite wet during October, receiving approximately 106 mm (4.2 in) of precipitation over 13 rainy days.
In contrast July, experiences much drier conditions, with 12 mm (0.5 in) of rainfall, spread across 6 rainy days.
October, the wettest month, has a maximum daytime temperature of 20°C (68°F). The city receives 166 hours of sunshine in this period. During the driest month July you can expect a temperature of 30°C (86°F). For more detailed insights into the city's temperatures, visit our Guarda Temperature page.
Annual Rainfall in Portugal: City Comparison
The map below shows the annual precipitation across Portugal. You can also select the different months in case you are interested in a specific month.
 heavy rainfall
 high
high
 moderate
 low
low
 almost none
Guarda vs World: Rainfall Compared
Guarda's average annual precipitation is 732 mm (29 in). Let's compare this to some popular worldwide tourist destinations:
In Toronto, Canada, annual precipitation averages 964 mm (38 in), with snowy winters and rainy summers.
In Shanghai, China, the annual average precipitation is 1347 mm (53 in), with a humid subtropical climate.
Melbourne, Australia, has 690 mm (27 in) of rainfall annually, spread fairly evenly throughout the year.
Kuala Lumpur, Malaysia, receives 2529 mm (100 in) of annual rainfall, characteristic of its equatorial tropical rainforest climate, with consistent rainfall throughout the year and peak months during March and November.
Precipitation amounts are measured using specific gauges installed at weather stations, collecting both rain and snow and any other type of precipitation. Rainfall is measured directly in millimeters, while that from snow and ice is obtained by melting it. Automated systems often incorporate heaters to make this easier.
Information from these stations is transmitted via Wi-Fi, satellite, GPS, or telephone connections to central monitoring networks. This information is immediately updated and integrated into weather models and forecasts.
- Mawsynram in India is noted as being the wettest place on earth, with over 11 meters (36 feet) of rain falling every year.
- In contrast, Antofagasta in Chile is among the driest places on the planet, getting less than 0.1mm (0.004 inches) per year, with some years recording virtually no rainfall.
- Nearly 1,650 thunderstorm cells are estimated over the planet at any given time.
For more detailed information about Guarda's weather, including sunshine hours, humidity levels, and temperature data, visit our Guarda Climate page.