El Nido Monthly Rainfall & Precipitation
This page shows both the average monthly rainfall and the number of rainy days in El Nido, Palawan, Philippines. This average is based on long-term data collected between 1990 and 2020. Let's now guide you through the details for a complete overview.
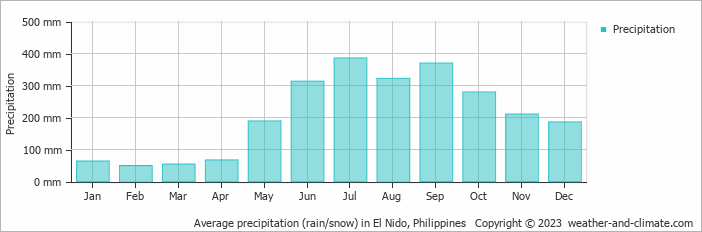
El Nido has a notably wet climate with abundant precipitation, recording 2487 mm (98 in) of rainfall per year. It does, however, have a distinct rainy season during certain months. Have a look at our detailed charts below to see how precipitation varies throughout the year.
Monthly Rainfall & Rainy Days
Monthly Precipitation Levels
The average number of days each month with precipitation (> 0.2 mm (0.01 in))
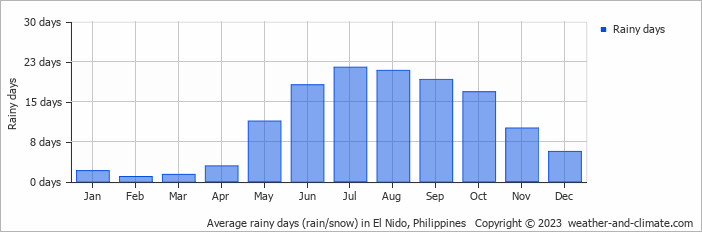
Significant seasonal changes in precipitation occur throughout the year. During the wettest month, July receives substantial rainfall, averaging 386 mm (15 in) of precipitation, recorded across 21 rainy days.
In contrast, the driest month, February brings less rainfall, with 49 mm (1.9 in) over a single rainy day.
July, the wettest month, has a maximum daytime temperature of 30°C (86°F). During the driest month February you can expect a temperature of 30°C (86°F). For more detailed insights into the city's temperatures, visit our El Nido Temperature page.
Explore El Nido's Historical Precipitation: 2006-2026
Browse day-by-day precipitation records for El Nido spanning 21 years. Select any month and year to see actual rainfall and snowfall recorded on each day.
Annual Rainfall in Philippines: City Comparison
The map below shows the annual precipitation across Philippines. You can also select the different months in case you are interested in a specific month.
El Nido vs World: Rainfall Compared
El Nido's average annual precipitation is 2487 mm (98 in). Let's compare this to some popular worldwide tourist destinations:
Athens, Greece, receives an average annual precipitation of 400 mm (16 in), making it one of the drier Mediterranean climates with rainfall mostly in winter.
Osaka, Japan, experiences 1507 mm (59 in) of rainfall annually, spread across the year with wetter summers.
Adelaide, Australia, enjoys 511 mm (20 in) of annual precipitation, with dry summers and wet winters.
Bangkok, Thailand, experiences a tropical monsoon climate with 1668 mm (66 in) of annual rainfall, with the heaviest precipitation occurring during September and October.
Precipitation amounts are measured using specific gauges installed at weather stations, collecting both rain and snow and any other type of precipitation. Rainfall is measured directly in millimeters, while that from snow and ice is obtained by melting it. Automated systems often incorporate heaters to make this easier.
Information from these stations is transmitted via Wi-Fi, satellite, GPS, or telephone connections to central monitoring networks. This information is immediately updated and integrated into weather models and forecasts.
Climate change is affecting precipitation patterns worldwide, including El Nido:
- Changing Rainfall Patterns: Global warming causes drastic changes in the patterns of rainfall. Some areas have been experiencing increased frequency and intensity of rainfall, while other areas experience longer dry spells or even droughts.
- Local Impacts: Many regions are experiencing heavier rainfall in the winter months and drier, hotter summers. This affects agriculture, water resources, and ecosystems.
- Mawsynram in India is noted as being the wettest place on earth, with over 11 meters (36 feet) of rain falling every year.
- In contrast, Antofagasta in Chile is among the driest places on the planet, getting less than 0.1mm (0.004 inches) per year, with some years recording virtually no rainfall.
- Nearly 1,650 thunderstorm cells are estimated over the planet at any given time.
For more detailed information about El Nido's weather, including sunshine hours, humidity levels, and temperature data, visit our El Nido Climate page.
El Nido Weather by Month
Pick a month to see the average temperature, rainfall and sunshine in El Nido - and find the best time to visit.
El Nido 3-Day Forecast
Temperature Rainfall
See the full El Nido climate overview or explore weather in Philippines.
Popular this month
Where to go in July - average daytime high across popular destinations.
Bucket list
Need travel inspiration? Check out our bucket list articles and be inspired.
 10 Hidden gems in Asia you need to visit
Explore 10 hidden gems in Asia offering authentic experiences, from pristine beaches and remote islands to cultural treks and peaceful mountain villages.
 The 10 Most Exquisite Beaches in the Philippines
Explore the top 10 breathtaking beaches in the Philippines, from serene Nacpan Beach to volcanic Camiguin Island, in our detailed guide.
Siquijor island, the island of magic, fireflies, small breathtaking bays and so much more
All the islands of the Philippines are beautiful, however Siquijor island stands out. It is the island of magic, fireflies, small breathtaking bays and so much more.
Stay at a 100% self-sustaining island resort
Coron was one of our favorite destinations in the world. The beauty of this island combined with the amazing hospitality and smiles of the Filipinos is a golden combination.