

















 Visit Sapa in Vietnam
Balancing on the edges of a rice field with endless views. A trek through the valley of Sapa is definitely a must for the bucket list.
This page shows both the average monthly rainfall and the number of rainy days in Doc Let, Khanh Hoa, Vietnam. These values are calculated using 30 years of data (1990–2020) to ensure accuracy. Now, let's break down all the details for a clearer picture.
Doc Let is known for its substantial rainfall, with annual precipitation reaching 1676 mm (66 in). While the overall climate is wet, there are notable seasonal patterns that create interesting contrasts, as demonstrated in our graph below.
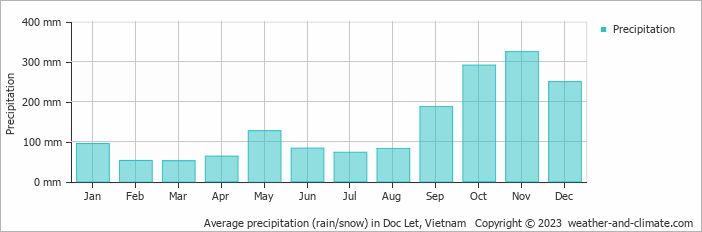
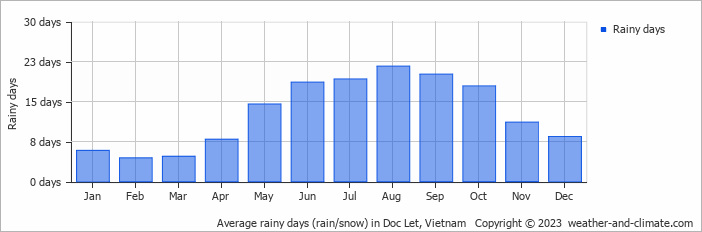
Doc Let can be quite wet during November, receiving approximately 324 mm (13 in) of precipitation over 11 rainy days.
In contrast March, experiences much drier conditions, with 51 mm (2 in) of rainfall, spread across 5 rainy days.
November, the wettest month, has a maximum daytime temperature of 28°C (82°F). The city receives 144 hours of sunshine in this period. During the driest month March you can expect a temperature of 29°C (84°F). For more detailed insights into the city's temperatures, visit our Doc Let Temperature page.
Average daily rainfall for each day of the month based on long-term records. 50-year average (1976-2025)
Browse day-by-day precipitation records for Doc Let spanning 51 years. Select any month and year to see actual rainfall and snowfall recorded on each day.
The map below shows the annual precipitation across Vietnam. You can also select the different months in case you are interested in a specific month.
Doc Let's average annual precipitation is 1676 mm (66 in). Let's compare this to some popular worldwide tourist destinations:
In Barcelona, Spain, the average annual precipitation is 620 mm (24 in), evenly distributed across the year with no extreme wet or dry seasons.
Osaka, Japan, experiences 1507 mm (59 in) of rainfall annually, spread across the year with wetter summers.
In Brisbane, Australia, the annual precipitation is 979 mm (39 in), making it wetter than Sydney.
Singapore, situated near the equator, gets 2581 mm (102 in) of rainfall annually, with no distinct dry season and consistent monthly precipitation.
Precipitation amounts are measured using specific gauges installed at weather stations, collecting both rain and snow and any other type of precipitation. Rainfall is measured directly in millimeters, while that from snow and ice is obtained by melting it. Automated systems often incorporate heaters to make this easier.
Information from these stations is transmitted via Wi-Fi, satellite, GPS, or telephone connections to central monitoring networks. This information is immediately updated and integrated into weather models and forecasts.
Precipitation has a very strong role in determining the local climate and ecosystem:
For more detailed information about Doc Let's weather, including sunshine hours, humidity levels, and temperature data, visit our Doc Let Climate page.
Pick a month to see the average temperature, rainfall and sunshine in Doc Let - and find the best time to visit.
Temperature Rainfall Sunshine Humidity
See the full Doc Let climate overview or explore weather in Vietnam.
Where to go in October - average daytime high across popular destinations.
Ho Chi Minh City 32°C (90°F) Hanoi
 31°C (88°F) Vung Tau30°C (86°F) Duong Dong29°C (84°F) Hoi An29°C (84°F) Nha Trang30°C (86°F) Da Nang29°C (84°F) Da Lat26°C (79°F)
 Need travel inspiration? Check out our bucket list articles and be inspired.
Visit Sapa in Vietnam
Balancing on the edges of a rice field with endless views. A trek through the valley of Sapa is definitely a must for the bucket list.

 Where to Go for Christmas: Sun, Value and Fewer Crowds
Where can you find warm Christmas weather without peak-season prices and huge crowds? Compare Marsa Alam, The Gambia, Vietnam, Agadir and Cap Skirring.
 Peace, beauty and silence in Vietnam
Vedana is located along the shores of a secluded, peaceful and serene lagoon, surrounded in lushly forested peaks. This ensures an isolated appeal and stunning views across a vast immense lagoon.
 Vietnam in February: North, Central or South?
Compare Vietnam's February weather in Hanoi, Da Nang, Nha Trang, Ho Chi Minh City and Phu Quoc to find the warmest, driest and sunniest region.