Bro Monthly Rainfall & Precipitation
This page shows both the average monthly rainfall and the number of rainy days in Bro, Funen, Denmark. These values are calculated using 30 years of data (1990–2020) to ensure accuracy. Now, let's explore all the details to give you a full picture.
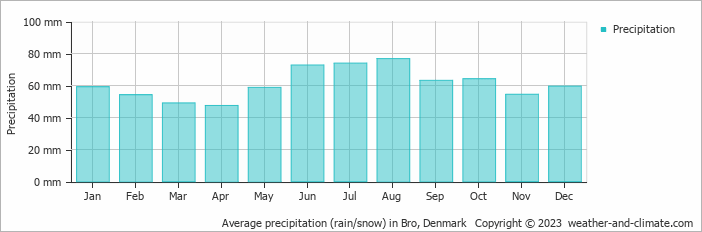
On average, Bro receives a reasonable amount of rain/snowfall, with an annual precipitation of 733 mm (29 in).
Monthly Precipitation Levels
The average number of days each month with precipitation (> 0.2 mm (0.01 in))
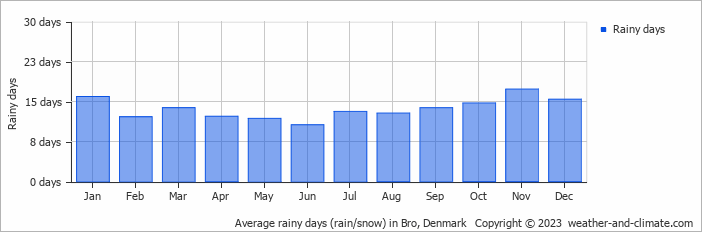
Precipitation levels in Bro remain relatively steady throughout the year. August has the most rain, with 77 mm (3 in) over 13 days. In April, this drops slightly to 47 mm (1.9 in), making the city's climate fairly predictable.
August, the wettest month, has a maximum daytime temperature of 22°C (72°F). The city receives 223 hours of sunshine in this period. During the driest month April you can expect a temperature of 13°C (55°F). For more detailed insights into the city's temperatures, visit our Bro Temperature page.
Annual Rainfall in Denmark: City Comparison
The map below shows the annual precipitation across Denmark. You can also select the different months in case you are interested in a specific month.
 heavy rainfall
 high
high
 moderate
 low
low
 almost none
Bro vs World: Rainfall Compared
Bro's average annual precipitation is 733 mm (29 in). Let's compare this to some popular worldwide tourist destinations:
The climate in San Francisco, USA, is influenced by coastal weather, with 469 mm (18 in) of rainfall mostly during the winter months.
Osaka, Japan, experiences 1507 mm (59 in) of rainfall annually, spread across the year with wetter summers.
In Tokyo, Japan, the average annual precipitation is 1528 mm (60 in), with significant summer rains due to typhoon season.
Mumbai, India, experiences a tropical monsoon climate with 1860 mm (73 in) of annual rainfall, with the majority of precipitation happening during the monsoon season from June to September.
Precipitation amounts are measured using specific gauges installed at weather stations, collecting both rain and snow and any other type of precipitation. Rainfall is measured directly in millimeters, while that from snow and ice is obtained by melting it. Automated systems often incorporate heaters to make this easier.
Information from these stations is transmitted via Wi-Fi, satellite, GPS, or telephone connections to central monitoring networks. This information is immediately updated and integrated into weather models and forecasts.
The proximity of a location to a large body of water can significantly affect its rainfall patterns:
- Ocean Influence: Coastal regions typically receive more rainfall due to the presence of moisture-laden winds from the ocean. These regions tend to have more humid climates and experience more frequent precipitation, especially in winter.
- Continental Climates: Areas further from the sea, such as inland or continental regions, experience less frequent rainfall and more extreme seasonal variations in precipitation.
- The U.S. has a significant number of thunderstorms every year, with over 14.6 million taking place across the world annually.
- Approximately 70% of lightning bolts strike land rather than oceans.
- A storm named John was the longest-lasting Pacific tropical storm, continuing for 31 days. As it crossed the dateline twice, it changed status from a hurricane to a typhoon and back to a hurricane.
For more detailed information about Bro's weather, including sunshine hours, humidity levels, and temperature data, visit our Bro Climate page.


