Santa Rosa de Copán Monthly Rainfall & Precipitation
This page shows both the average monthly rainfall and the number of rainy days in Santa Rosa de Copán, Copán Department, Honduras. The numbers reflect climate data gathered over a 30-year period, from 1990 to 2020. Now, let's break down all the details for a clearer picture.
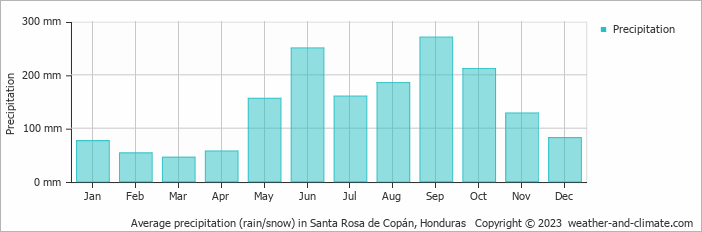
Santa Rosa de Copán has a notably wet climate with abundant precipitation, recording 1675 mm (66 in) of rainfall per year. It does, however, have a distinct rainy season during certain months. Have a look at our detailed charts below to see how precipitation varies throughout the year.
Monthly Rainfall & Rainy Days
Monthly Precipitation Levels
The average number of days each month with precipitation (> 0.2 mm (0.01 in))
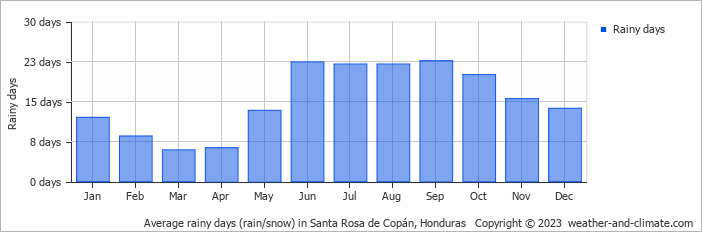
Santa Rosa de Copán can be quite wet during September, receiving approximately 271 mm (11 in) of precipitation over 23 rainy days.
In contrast March, experiences much drier conditions, with 45 mm (1.8 in) of rainfall, spread across 6 rainy days.
September, the wettest month, has a maximum daytime temperature of 29°C (84°F). During the driest month March you can expect a temperature of 28°C (82°F). For more detailed insights into the city's temperatures, visit our Santa Rosa de Copán Temperature page.
Daily Historical Precipitation
Average daily rainfall for each day of the month based on long-term records. 41-year average (1976-2025)
Average precipitation in August
Explore Santa Rosa de Copán's Historical Precipitation: 1976-2026
Browse day-by-day precipitation records for Santa Rosa de Copán spanning 51 years. Select any month and year to see actual rainfall and snowfall recorded on each day.
Annual Rainfall in Honduras: City Comparison
The map below shows the annual precipitation across Honduras. You can also select the different months in case you are interested in a specific month.
Santa Rosa de Copán vs World: Rainfall Compared
Santa Rosa de Copán's average annual precipitation is 1675 mm (66 in). Let's compare this to some popular worldwide tourist destinations:
Seville, Spain, experiences 541 mm (21 in) of rainfall annually, with wet winters and dry summers typical of southern Spain.
Beijing, China, receives 560 mm (22 in) of annual precipitation, concentrated in the summer months.
Perth, Australia, receives 565 mm (22 in) of rainfall annually, mostly during the winter months.
Kuala Lumpur, Malaysia, receives 2529 mm (100 in) of annual rainfall, characteristic of its equatorial tropical rainforest climate, with consistent rainfall throughout the year and peak months during March and November.
Precipitation amounts are measured using specific gauges installed at weather stations, collecting both rain and snow and any other type of precipitation. Rainfall is measured directly in millimeters, while that from snow and ice is obtained by melting it. Automated systems often incorporate heaters to make this easier.
Information from these stations is transmitted via Wi-Fi, satellite, GPS, or telephone connections to central monitoring networks. This information is immediately updated and integrated into weather models and forecasts.
Climate change is affecting precipitation patterns worldwide, including Santa Rosa de Copán:
- Changing Rainfall Patterns: Global warming causes drastic changes in the patterns of rainfall. Some areas have been experiencing increased frequency and intensity of rainfall, while other areas experience longer dry spells or even droughts.
- Local Impacts: Many regions are experiencing heavier rainfall in the winter months and drier, hotter summers. This affects agriculture, water resources, and ecosystems.
- "Ginger" was the longest-lasting Atlantic tropical storm, which spun around the open ocean for 28 days in 1971.
- The world's largest snowflake was recorded in the Guinness Book of Records, at 38 cm (15 inches) wide and 20 cm (7.9 inches) thick. The snowflake fell at Fort Keogh, Montana, USA, on 28 January 1887.
- The greatest snowfall recorded was on Mt. Rainier, Washington State, USA, over 31.5 meters (103 feet) fell during the winter of 1972.
For more detailed information about Santa Rosa de Copán's weather, including sunshine hours, humidity levels, and temperature data, visit our Santa Rosa de Copán Climate page.
Santa Rosa de Copán Weather by Month
Pick a month to see the average temperature, rainfall and sunshine in Santa Rosa de Copán - and find the best time to visit.
Santa Rosa de Copán 3-Day Forecast
Temperature Rainfall Humidity Wind Speed
See the full Santa Rosa de Copán climate overview or explore weather in Honduras.
Popular this month
Where to go in August - average daytime high across popular destinations.
Bucket list
Need travel inspiration? Check out our bucket list articles and be inspired.
 Pico Bonito: Honduras' enchanting jungle adventure awaits
Explore Pico Bonito, Honduras' largest national park. Discover diverse wildlife, exhilarating activities, and lush landscapes. Your jungle adventure begins here!
 The top 5 unexplored rainforests in Central America
Dive into Central America's top 5 hidden rainforests for an unparalleled journey through vibrant wildlife and diverse landscapes.
The unspoiled Bahía Islands in Honduras
Discover Roatán, the largest of the Bahía Islands, a paradise for divers and snorkelers with stunning reefs and wildlife. Best visited February to July.