San Rafael Monthly Rainfall & Precipitation
This page shows both the average monthly rainfall and the number of rainy days in San Rafael, Mendoza Province, Argentina. This average is based on long-term data collected between 1990 and 2020. Let's explore the details to provide you with a complete overview.
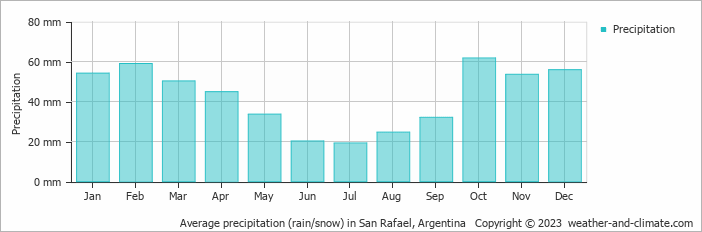
Generally, San Rafael has a moderate amount of precipitation, averaging 509 mm (20 in) of rain/snowfall annually. However, it does experience a distinct dry season during certain months. Take a look at our detailed charts below to see the seasonal variation.
Monthly Rainfall & Rainy Days
Monthly Precipitation Levels
The average number of days each month with precipitation (> 0.2 mm (0.01 in))
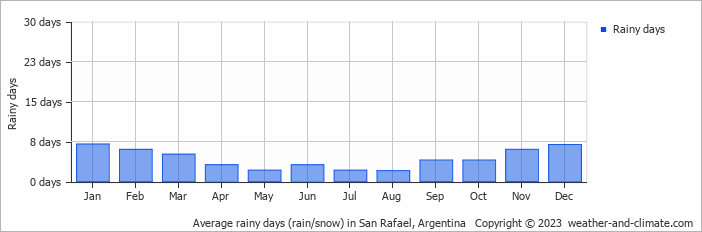
The seasons in San Rafael, bring significant changes in precipitation. The wettest month, October, receives moderate rainfall, with an average of 62 mm (2.4 in) of precipitation. This rainfall is distributed across 4 rainy days.
In contrast, the driest month, July, experiences much less rainfall, totaling 19 mm (0.7 in) over 2 rainy days. These distinct seasonal differences provide diverse experiences throughout the year.October, the wettest month, has a maximum daytime temperature of 24°C (75°F). The city receives 253 hours of sunshine in this period. During the driest month July you can expect a temperature of 15°C (59°F). For more detailed insights into the city's temperatures, visit our San Rafael Temperature page.
Daily Historical Precipitation
Average daily rainfall for each day of the month based on long-term records. 50-year average (1976-2025)
Average precipitation in July
Explore San Rafael's Historical Precipitation: 1976-2026
Browse day-by-day precipitation records for San Rafael spanning 51 years. Select any month and year to see actual rainfall and snowfall recorded on each day.
Annual Rainfall in Argentina: City Comparison
The map below shows the annual precipitation across Argentina. You can also select the different months in case you are interested in a specific month.
San Rafael vs World: Rainfall Compared
San Rafael's average annual precipitation is 509 mm (20 in). Let's compare this to some popular worldwide tourist destinations:
In Lisbon, Portugal, the average annual precipitation is 774 mm (30 in), characterized by wet winters and dry summers typical of the Mediterranean climate.
In Seoul, South Korea, the average annual precipitation is 1237 mm (49 in), with most rain falling during the summer monsoon season.
Perth, Australia, receives 565 mm (22 in) of rainfall annually, mostly during the winter months.
Mumbai, India, experiences a tropical monsoon climate with 1860 mm (73 in) of annual rainfall, with the majority of precipitation happening during the monsoon season from June to September.
Precipitation amounts are measured using specific gauges installed at weather stations, collecting both rain and snow and any other type of precipitation. Rainfall is measured directly in millimeters, while that from snow and ice is obtained by melting it. Automated systems often incorporate heaters to make this easier.
Information from these stations is transmitted via Wi-Fi, satellite, GPS, or telephone connections to central monitoring networks. This information is immediately updated and integrated into weather models and forecasts.
Climate change is affecting precipitation patterns worldwide, including San Rafael:
- Changing Rainfall Patterns: Global warming causes drastic changes in the patterns of rainfall. Some areas have been experiencing increased frequency and intensity of rainfall, while other areas experience longer dry spells or even droughts.
- Local Impacts: Many regions are experiencing heavier rainfall in the winter months and drier, hotter summers. This affects agriculture, water resources, and ecosystems.
- "Ginger" was the longest-lasting Atlantic tropical storm, which spun around the open ocean for 28 days in 1971.
- The world's largest snowflake was recorded in the Guinness Book of Records, at 38 cm (15 inches) wide and 20 cm (7.9 inches) thick. The snowflake fell at Fort Keogh, Montana, USA, on 28 January 1887.
- The greatest snowfall recorded was on Mt. Rainier, Washington State, USA, over 31.5 meters (103 feet) fell during the winter of 1972.
For more detailed information about San Rafael's weather, including sunshine hours, humidity levels, and temperature data, visit our San Rafael Climate page.
San Rafael Weather by Month
Pick a month to see the average temperature, rainfall and sunshine in San Rafael - and find the best time to visit.
San Rafael 3-Day Forecast
Temperature Rainfall Sunshine Humidity Wind Speed
See the full San Rafael climate overview or explore weather in Argentina.
Popular this month
Where to go in July - average daytime high across popular destinations.
Bucket list
Need travel inspiration? Check out our bucket list articles and be inspired.
 The 10 most alternative cities in South America
Discover South America's top 10 alternative cities! From Valparaíso's vibrant streets to La Paz's high-altitude charm and Medellín's innovative spirit.
Be amazed by Buenos Aires
The city of beautiful museums, cute streets, green parks, lots of good food, interesting local neighborhoods and impressive historical buildings.
Explore Patagonia
A tour through Patagonia brings you to the end of the world. That’s why Patagonia is a bucket list destination for many. We recommend to visit Patagonia from November to early March.
Glacier walk on The Perito Moreno glacier
The Perito Moreno glacier and the rupture of this glacier is considered one of the most impressive natural spectacles in the world. You can wait here until a large piece of ice crumbles and plunges into the water with a lot of noise.