
Noumea Monthly Rainfall & Precipitation
This page shows both the average monthly rainfall and the number of rainy days in Noumea, New Caledonia. This average is based on long-term data collected between 1990 and 2020. Let's explore the details to provide you with a complete overview.
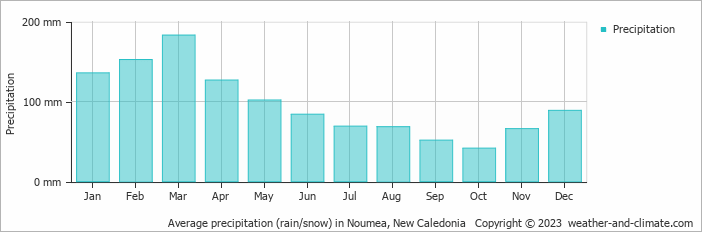
Noumea has a relatively rainy climate with high precipitation levels, averaging 1168 mm (46 in) of rainfall annually.
Monthly Rainfall & Rainy Days
Monthly Precipitation Levels
The average number of days each month with precipitation (> 0.2 mm (0.01 in))
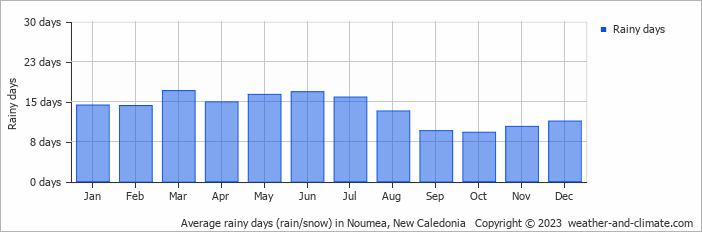
The seasons in Noumea, bring significant changes in precipitation. The wettest month, March, receives heavy rainfall, with an average of 183 mm (7.2 in) of precipitation. This rainfall is distributed across 17 rainy days.
In contrast, the driest month, October, experiences much less rainfall, totaling 42 mm (1.7 in) over 9 rainy days. These distinct seasonal differences provide diverse experiences throughout the year.March, the wettest month, has a maximum daytime temperature of 28°C (82°F). The city receives 198 hours of sunshine in this period. During the driest month October you can expect a temperature of 24°C (75°F). For more detailed insights into the city's temperatures, visit our Noumea Temperature page.
Daily Historical Precipitation
Average daily rainfall for each day of the month based on long-term records. 50-year average (1976-2025)
Average precipitation in September
Explore Noumea's Historical Precipitation: 1976-2026
Browse day-by-day precipitation records for Noumea spanning 51 years. Select any month and year to see actual rainfall and snowfall recorded on each day.
Annual Rainfall in New Caledonia: City Comparison
The map below shows the annual precipitation across New Caledonia. You can also select the different months in case you are interested in a specific month.
Noumea vs World: Rainfall Compared
Noumea's average annual precipitation is 1168 mm (46 in). Let's compare this to some popular worldwide tourist destinations:
Seville, Spain, experiences 541 mm (21 in) of rainfall annually, with wet winters and dry summers typical of southern Spain.
In Shanghai, China, the annual average precipitation is 1347 mm (53 in), with a humid subtropical climate.
Melbourne, Australia, has 690 mm (27 in) of rainfall annually, spread fairly evenly throughout the year.
Singapore, situated near the equator, gets 2581 mm (102 in) of rainfall annually, with no distinct dry season and consistent monthly precipitation.
Precipitation amounts are measured using specific gauges installed at weather stations, collecting both rain and snow and any other type of precipitation. Rainfall is measured directly in millimeters, while that from snow and ice is obtained by melting it. Automated systems often incorporate heaters to make this easier.
Information from these stations is transmitted via Wi-Fi, satellite, GPS, or telephone connections to central monitoring networks. This information is immediately updated and integrated into weather models and forecasts.
Precipitation has a very strong role in determining the local climate and ecosystem:
- Changing Rainfall Patterns: Global warming causes drastic changes in the patterns of rainfall. Some areas have been experiencing increased frequency and intensity of rainfall, while other areas experience longer dry spells or even droughts.
- Local Impacts: Many regions are experiencing heavier rainfall in the winter months and drier, hotter summers. This affects agriculture, water resources, and ecosystems.
- The U.S. has a significant number of thunderstorms every year, with over 14.6 million taking place across the world annually.
- Approximately 70% of lightning bolts strike land rather than oceans.
- A storm named John was the longest-lasting Pacific tropical storm, continuing for 31 days. As it crossed the dateline twice, it changed status from a hurricane to a typhoon and back to a hurricane.
For more detailed information about Noumea's weather, including sunshine hours, humidity levels, and temperature data, visit our Noumea Climate page.
Noumea Weather by Month
Pick a month to see the average temperature, rainfall and sunshine in Noumea - and find the best time to visit.





Noumea 3-Day Forecast
Temperature Rainfall Sunshine Humidity Wind Speed Water Temp
See the full Noumea climate overview or explore weather in New Caledonia.
Popular in September
Where to go in September - average daytime high across popular destinations.















Bucket list
Need travel inspiration? Check out our bucket list articles and be inspired.
 An alternative way to discover Sydney
We have made an overview of the sights in Sydney that you must see if you want to visit Sydney in an alternative way.
 The Tongariro Crossing in New Zealand
It is called the most beautiful walk in New Zealand, the Tongariro Crossing. The official hiking season starts late October until end of April.
The most relaxed and alternative area of Australia is called the Byron Shire
The Byron Shire is one of the most pretty areas in the world. Not only in terms on natural beauty, also the relaxed vibe and people make this an area that remains close to your heart.
Sail the Whitsunday islands
The best travel period to sail the Whitsunday islands is “winter” between June and October, with pleasant temperatures around 23 degrees Celsius (74 Fahrenheit).