Torpè Temperature by Month
Torpè in Sardinia, Italy sees significant seasonal temperature differences, with daytime highs between 14°C (57°F) in February and 29°C (84°F) in August, averaging 20°C (68°F) annually. Explore the full monthly breakdown below.
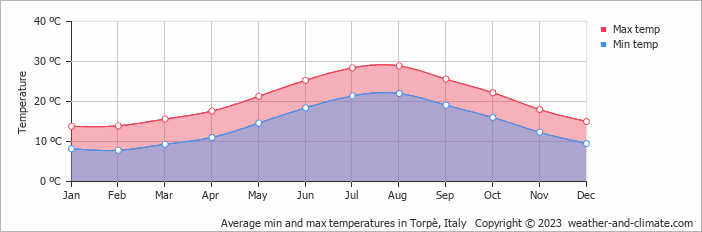
Torpè Monthly Temperatures
The climate in Torpè is dynamic, ranging widely from moderate in winter to comfortable in summer. Nights are significantly colder, with lows dropping from 22°C (72°F) in August to 8°C (46°F) in February.
The chart below illustrates the average maximum day and minimum night temperatures in Torpè by month:
From around 4 AM to 6 AM temperatures are at their lowest; by 3 PM they've climbed to their daily peak. August, the warmest month, averages 320 hours of sunshine.
The chart below shows the average temperature throughout the year:
Temperature: Torpè vs Italy
The map below shows the annual temperature across Italy. You can also select individual months if you want to compare a specific time of year.
 very warm
 warm
warm
 pleasant
 moderate
 cold
cold
 very cold
Torpè vs World: Temperature Compared
Torpè's average annual maximum temperature is 20°C (68°F). To put that in context, here's how it compares to a few well-known destinations:
Lisbon, Portugal averages 21°C (70°F) annually — warm summers, mild winters, and rain mainly in the cooler months.
On the cooler end, Oslo, Norway averages just 10°C (50°F) annually, with pleasant summers but long, cold winters.
Boston, USA averages 16°C (61°F) annually, with four distinct seasons and cold winters that rival northern Europe.
Melbourne, Australia averages 20°C (68°F) annually — known for unpredictable weather, with four seasons sometimes happening in one day.
What Does the Temperature Feel Like in Torpè?
Temperature alone doesn't tell the whole story — humidity plays a big role in how warm or cold it actually feels. High humidity in summer makes the heat feel more intense, particularly once temperatures climb above 25°C. In winter, the same humidity can make cold air feel sharper than the thermometer suggests.
In Torpè, February is the coolest month, with average highs of 14°C (57°F) and humidity around 68% — considered high. In August, the warmest month, temperatures average 29°C (84°F) with 63% humidity — conditions that feel high. For a full picture, see our humidity page.
Climate temperature data is typically calculated as a 30-year average. This smooths out year-to-year variability and gives a more reliable picture of what a place is actually like, rather than what happened in any single unusual year.
The readings come from a range of sources — land-based weather stations, ocean buoys, ships, and satellites. That data is collected by weather services around the world, then pooled, quality-checked, and averaged to produce the climate records you see here.
For cities and regions with significant elevation, altitude is one of the biggest factors shaping local temperatures. As a rule of thumb, temperatures fall by around 6°C for every 1,000 metres gained — so a city at 2,000 metres will typically be around 12°C cooler than a city at sea level in the same region. Higher ground also tends to see more dramatic day-to-night temperature swings, since thinner air loses heat faster after sunset.
For more on Torpè's weather — including monthly rainfall, sunshine hours, and humidity — visit our Torpè climate page.


