

Sultānpur Temperatures: Monthly Averages and Year-Round Insights
On this page, we’ll explore Sultānpur’s temperature statistics in detail, including day and night variations and monthly averages. We’ll also compare the annual temperature to other cities in India.
Monthly Temperature Averages
With significant temperature fluctuations, Sultānpur enjoys distinct seasons year-round. Average maximum daytime temperatures reach a very hot 41°C in May. In January, the coolest month of the year, temperatures drop to a warm 23°C. At night, expect even cooler temperatures, with lows averaging around 10°C.
The chart below illustrates the average maximum day and minimum night temperatures in Sultānpur by month:
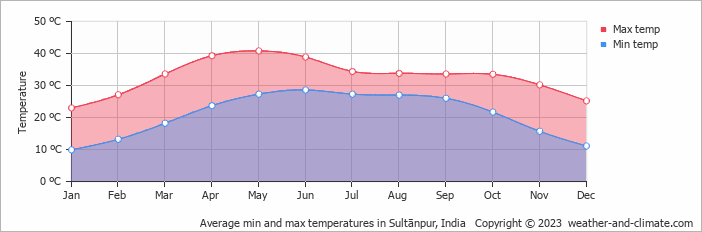
Typically, the coolest time of day is between 4 AM and 6 AM, while the hottest time occurs around 3 PM, when the sun’s heating effect is strongest.
The chart below shows the average temperature throughout the year:
January, the city’s coldest month, sees about 24 mm of rainfall spread over roughly a single day.
Annual Temperatures in India Compared
The map below shows the annual temperature across India. You can also select the different months in case you are interested in a specific month.
 very warm
 warm
warm
 pleasant
 moderate
 cold
cold
 very cold
Sultānpur Temperatures Compared World Wide
Sultānpur’s average annual maximum temperature is 33°C. Let’s compare this with some popular tourist destinations:
In Lisbon, Portugal, the average annual temperature is 21°C, offering warm summers and mild, rainy winters.
Glasgow, Scotland, the average annual temperature is significantly lower at 13°C, with mild summers and cold winters.
Osaka, Japan, offers a similar climate to Tokyo, with an average annual temperature of 22°C.
In Tokyo, Japan, the average annual temperature is 21°C, expect warmer summers and milder winters.
How are these Temperatures Measured?
Generally, temperature data depicting climate is usually given over a 30-year average in order to reduce short-term fluctuations and reveal better long-term trends in climate conditions.
This temperature data is taken from land-based thermometers, ocean buoys, ships, and satellites. These measurements are transmitted to weather stations and climate centers around the globe where they are processed, averaged, and analyzed in order to monitor the trends and create climate models.
Temperatures in the Mountains
Although not all regions have mountains, elevated areas exhibit distinct temperature variations.
- Sun Exposure: Sunlit slopes tend to be warmer, while shaded areas remain cooler.
- Altitude Effects: Temperatures drop by approximately 6°C for every 1,000 meters of elevation, creating distinct microclimates.
For more detailed information about Sultānpur’s weather, including monthly rainfall, sunshine hours, and humidity levels, visit our Sultānpur climate page.
Current temperature in Sultānpur
 4 m/s
4 m/s
almost clear and no rain
3 m/s
clear and no rain
1 m/s
clear and no rain