Sígrion Temperature by Month
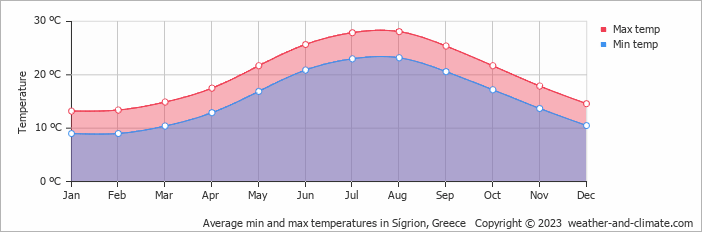
The average annual maximum temperature in Sígrion, Lesbos, Greece is 20°C (68°F), with daytime highs ranging from 13°C (55°F) in January to 28°C (82°F) in August. This page covers monthly averages, day-night differences, and how Sígrion compares to cities worldwide.
Sígrion Monthly Temperatures
The climate in Sígrion is dynamic, ranging widely from moderate in winter to comfortable in summer. Nights are significantly colder, with lows dropping from 23°C (73°F) in August to 9°C (48°F) in January.
The chart below illustrates the average maximum day and minimum night temperatures in Sígrion by month:
Daily lows are most common between 4 AM and 6 AM. By 3 PM temperatures reach their daily high, driven by peak solar heating.
The chart below shows the average temperature throughout the year:
Temperature: Sígrion vs Greece
The map below shows the annual temperature across Greece. You can also select individual months if you want to compare a specific time of year.
Sígrion vs World: Temperature Compared
Sígrion's average annual maximum temperature is 20°C (68°F). To put that in context, here's how it compares to a few well-known destinations:
Rome, Italy averages 20°C (68°F) annually, with reliably warm summers and comfortable winters.
Queenstown, New Zealand averages 10°C (50°F) annually, remember seasons are flipped, so its coldest months fall in June and July.
Beijing, China averages 20°C (68°F) annually, but with big seasonal swings, very cold winters and hot summers.
Adelaide, Australia averages 21°C (70°F) a year, with warm summers, mild winters, and relatively low rainfall year-round.
Climate temperature data is typically calculated as a 30-year average. This smooths out year-to-year variability and gives a more reliable picture of what a place is actually like, rather than what happened in any single unusual year.
The readings come from a range of sources, land-based weather stations, ocean buoys, ships, and satellites. That data is collected by weather services around the world, then pooled, quality-checked, and averaged to produce the climate records you see here.
Seasonal temperature shifts influence more than just how warm it feels, they also drive changes in rainfall, cloud cover, and wind patterns throughout the year.
Warmer air holds more moisture, which tends to mean heavier or more frequent rain during the warmer months. When temperatures drop in winter, any precipitation that does fall is more likely to come as snow or sleet, though in Sígrion this rarely lasts long on the ground.
For more on Sígrion's weather, including monthly rainfall, sunshine hours, and humidity, visit our Sígrion climate page.
Sígrion Weather by Month
Pick a month to see the average temperature, rainfall and sunshine in Sígrion - and find the best time to visit.
Sígrion 3-Day Forecast
Temperature Rainfall
See the full Sígrion climate overview or explore weather in Greece.
Popular this month
Where to go in July - average daytime high across popular destinations.
Bucket list
Need travel inspiration? Check out our bucket list articles and be inspired.
 Top 5 secluded beaches in Greece
Explore Greece's hidden gems: secluded beaches like Fokos, Seychelles, Potami, Kedrodasos, and Mouros for tranquil adventures away from crowds.
Discover Zakynthos
On the Greek island you can discover the rugged coastline, authentic old villages, a beautiful interior and the caves with the beautiful azure water.
Why Santorini should be on every Bucket List
This Greek island is home to some of the most stunning scenery globally, with its beautiful Caldera views, white-washed houses and crystal-clear waters.