


















 Costa Rica in February: Pacific or Caribbean Coast?
Compare Costa Rica weather in February, from dry and sunny Tamarindo to wetter Puerto Viejo, plus Jacó, Arenal and San José.
Santa Elena, Puntarenas, Costa Rica has a consistently comfortable climate year-round, with daytime highs averaging 29°C (84°F). Below you'll find a full monthly breakdown and a comparison with cities worldwide.
The temperature in Santa Elena changes very little across the seasons, maintaining a similar climate throughout the year. Maximum daytime temperatures range from a comfortable 28°C (82°F) in November to a very warm 31°C (88°F) in April. Nighttime lows range from 21°C (70°F) in April to 19°C (66°F) in November.
The chart below illustrates the average maximum day and minimum night temperatures in Santa Elena by month:
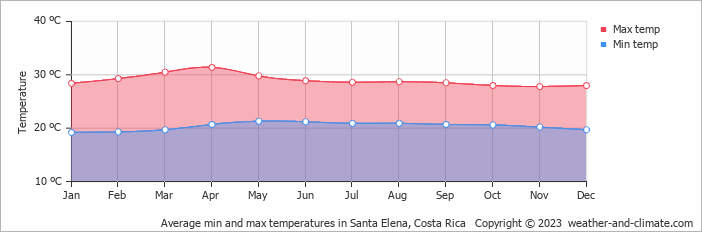
Temperatures tend to bottom out between 4 AM and 6 AM, then climb to their daily peak around 3 PM. April, the warmest month, sees 255 hours of sunshine.
The chart below shows the average temperature throughout the year:
The map below shows the annual temperature across Costa Rica. You can also select individual months if you want to compare a specific time of year.
Santa Elena's average annual maximum temperature is 29°C (84°F). To put that in context, here's how it compares to a few well-known destinations:
Lisbon, Portugal averages 21°C (70°F) annually, warm summers, mild winters, and rain mainly in the cooler months.
Toronto, Canada averages 13°C (55°F) annually, with cold snowy winters balanced by genuinely warm summers.
San Francisco, USA averages 19°C (66°F) annually, but with little seasonal variation, summers are often cool and foggy, winters mild.
Brisbane, Australia averages 26°C (79°F) a year, with warm winters and hot, humid summers.
Climate temperature data is typically calculated as a 30-year average. This smooths out year-to-year variability and gives a more reliable picture of what a place is actually like, rather than what happened in any single unusual year.
The readings come from a range of sources, land-based weather stations, ocean buoys, ships, and satellites. That data is collected by weather services around the world, then pooled, quality-checked, and averaged to produce the climate records you see here.
Global average temperatures have risen by around 1.2°C since the pre-industrial era, and the effects are visible across many regions. Winters are milder on average, with fewer frost days and less snow in many parts of the world. Heatwaves are more frequent and more intense, and Europe's summers of 2018, 2019, and 2020 all set records.
Summers are also getting drier in some areas, while winter rainfall has increased in others. This contributies to higher river levels and more flooding. In many countries, spring arrives earlier and autumn lasts longer. It has knock-on effects for wildlife, agriculture, and local ecosystems.
For more on Santa Elena's weather, including monthly rainfall, sunshine hours, and humidity, visit our Santa Elena climate page.
Pick a month to see the average temperature, rainfall and sunshine in Santa Elena - and find the best time to visit.
See the full Santa Elena climate overview or explore weather in Costa Rica.
Where to go in October - average daytime high across popular destinations.
Tamarindo 30°C (86°F) Santa Teresa28°C (82°F) Cahuita29°C (84°F) Fortuna28°C (82°F) Puerto Viejo de Talamanca29°C (84°F) Herradura28°C (82°F) Jacó28°C (82°F) San José24°C (75°F)
 Need travel inspiration? Check out our bucket list articles and be inspired.
Costa Rica in February: Pacific or Caribbean Coast?
Compare Costa Rica weather in February, from dry and sunny Tamarindo to wetter Puerto Viejo, plus Jacó, Arenal and San José.
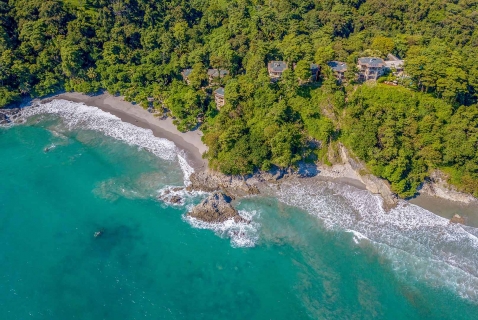 Where the rain forest meets the ocean
I promise that you will not find a better location, better views, nicer rooms or lovelier staff anywhere in Costa Rica. This place really goes above and beyond.
 Exploring Santa Teresa, Costa Rica: A Traveler's Guide
Immerse yourself in the laid-back charm of Santa Teresa, Costa Rica. Discover stunning beaches, vibrant dining spots, unique shops, and diverse activities in our comprehensive guide
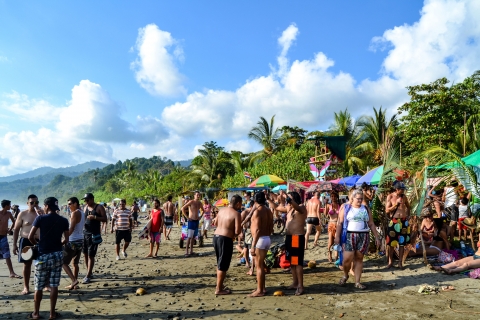 Envision Festival
This event happens once a year in Uvita de Puntarenas and attracts people from all over the world. This festival is a must add to your bucket list.