Neskaupstaður Temperature by Month
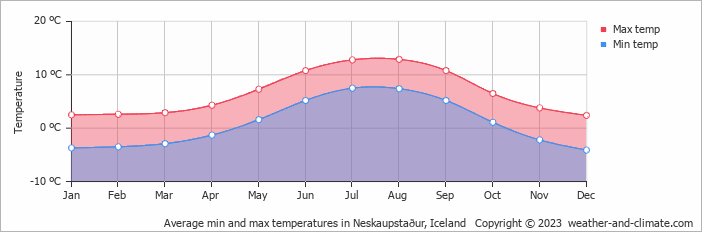
Neskaupstaður in East Iceland, Iceland sees moderate seasonal temperature shifts, with daytime highs between 2°C (36°F) in December and 13°C (55°F) in August, averaging 7°C (45°F) annually. Explore the full monthly breakdown below.
Neskaupstaður Monthly Temperatures
In Neskaupstaður, seasonal changes bring about a moderate variation in temperatures. Nighttime lows range from 7°C (45°F) in August to -4°C (25°F) in December.
The chart below illustrates the average maximum day and minimum night temperatures in Neskaupstaður by month:
Temperatures tend to bottom out between 4 AM and 6 AM, then climb to their daily peak around 3 PM.
The chart below shows the average temperature throughout the year:
Temperature: Neskaupstaður vs Iceland
The map below shows the annual temperature across Iceland. You can also select individual months if you want to compare a specific time of year.
Neskaupstaður vs World: Temperature Compared
Neskaupstaður's average annual maximum temperature is 7°C (45°F). To put that in context, here's how it compares to a few well-known destinations:
Barcelona, Spain has an annual average of around 21°C (70°F), with warm summers and mild, fairly short winters.
Toronto, Canada averages 13°C (55°F) annually, with cold snowy winters balanced by genuinely warm summers.
Shanghai, China averages 21°C (70°F) a year, with warm summers, mild winters, and a noticeable spring and autumn.
Tokyo, Japan averages 21°C (70°F) a year, with hot summers, cool winters, and a well-defined cherry blossom spring.
Climate temperature data is typically calculated as a 30-year average. This smooths out year-to-year variability and gives a more reliable picture of what a place is actually like, rather than what happened in any single unusual year.
The readings come from a range of sources, land-based weather stations, ocean buoys, ships, and satellites. That data is collected by weather services around the world, then pooled, quality-checked, and averaged to produce the climate records you see here.
For cities and regions with significant elevation, altitude is one of the biggest factors shaping local temperatures. As a rule of thumb, temperatures fall by around 6°C for every 1,000 metres gained, so a city at 2,000 metres will typically be around 12°C cooler than a city at sea level in the same region. Higher ground also tends to see more dramatic day-to-night temperature swings, since thinner air loses heat faster after sunset.
For more on Neskaupstaður's weather, including monthly rainfall, sunshine hours, and humidity, visit our Neskaupstaður climate page.
Neskaupstaður Weather by Month
Pick a month to see the average temperature, rainfall and sunshine in Neskaupstaður - and find the best time to visit.
Neskaupstaður 3-Day Forecast
Temperature Rainfall
See the full Neskaupstaður climate overview or explore weather in Iceland.
Popular this month
Where to go in September - average daytime high across popular destinations.
 Reykjavík
 12°C (54°F) Kópavogur12°C (54°F) Hella
 13°C (55°F) Selfoss12°C (54°F) Keflavík12°C (54°F) Höfn10°C (50°F) Egilsstadir
 10°C (50°F) Akureyri9°C (48°F)
















Bucket list
Need travel inspiration? Check out our bucket list articles and be inspired.
Iceland Airwaves Festival
On its way to its 20th edition in 2019 Iceland Airwaves is a festival you need to visit once in your life. Everything from lagoons and bookstores to bars and concert halls is filled with music.
Where to stay in Iceland: Nordic idyll that feels like home
If you are travelling to Iceland for the first time, the Golden Circle will probably make it onto your bucket list. Geysir Hestar is located right in between two spectacular sights of the Golden Circle.
 See the northern lights
The northern lights, polar light or Aarora Borealis is a true spectacle of nature! Green, sometimes purple, red and yellow streaks of light colors the dark skies.