Mawlamyine Temperature by Month
The average annual maximum temperature in Mawlamyine, Myanmar (Burma) is 33°C (91°F), with little variation between seasons. This page covers monthly averages, day-night differences, and how Mawlamyine compares to cities worldwide.
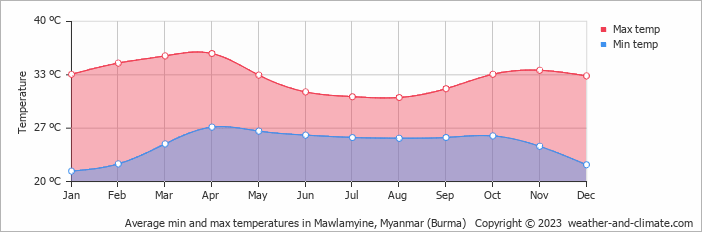
Mawlamyine Monthly Temperatures
The climate in Mawlamyine remains fairly constant, offering very warm temperatures throughout the year. Maximum daytime temperatures reach a very hot 36°C (97°F) in April, dropping to a very warm 31°C (88°F) in January. Nighttime lows stay between 27°C (81°F) and 21°C (70°F).
The chart below illustrates the average maximum day and minimum night temperatures in Mawlamyine by month:
The coolest part of the day is typically between 4 AM and 6 AM, while 3 PM is usually the warmest, when solar heating is at its peak.
The chart below shows the average temperature throughout the year:
Historical Mawlamyine Temperatures: 1976-2026
Browse day-by-day temperature records for Mawlamyine spanning 51 years. Select any month and year to see actual high and low temperatures recorded on each day.
Temperature: Mawlamyine vs Myanmar (Burma)
The map below shows the annual temperature across Myanmar (Burma). You can also select individual months if you want to compare a specific time of year.
 very warm
 warm
warm
 pleasant
 moderate
 cold
cold
 very cold
Mawlamyine vs World: Temperature Compared
Mawlamyine's average annual maximum temperature is 33°C (91°F). To put that in context, here's how it compares to a few well-known destinations:
Rome, Italy averages 20°C (68°F) annually, with reliably warm summers and comfortable winters.
Glasgow, Scotland averages 13°C (55°F) a year — mild but often grey, with cold winters and rarely hot summers.
New York City, USA averages 17°C (63°F) a year, with hot humid summers and cold winters that bring regular snowfall.
Perth, Australia averages 25°C (77°F) annually, with a classic Mediterranean climate — hot dry summers and mild wet winters.
Climate temperature data is typically calculated as a 30-year average. This smooths out year-to-year variability and gives a more reliable picture of what a place is actually like, rather than what happened in any single unusual year.
The readings come from a range of sources — land-based weather stations, ocean buoys, ships, and satellites. That data is collected by weather services around the world, then pooled, quality-checked, and averaged to produce the climate records you see here.
For cities and regions with significant elevation, altitude is one of the biggest factors shaping local temperatures. As a rule of thumb, temperatures fall by around 6°C for every 1,000 metres gained — so a city at 2,000 metres will typically be around 12°C cooler than a city at sea level in the same region. Higher ground also tends to see more dramatic day-to-night temperature swings, since thinner air loses heat faster after sunset.
For more on Mawlamyine's weather — including monthly rainfall, sunshine hours, and humidity — visit our Mawlamyine climate page.


