Letterkenny Temperature by Month
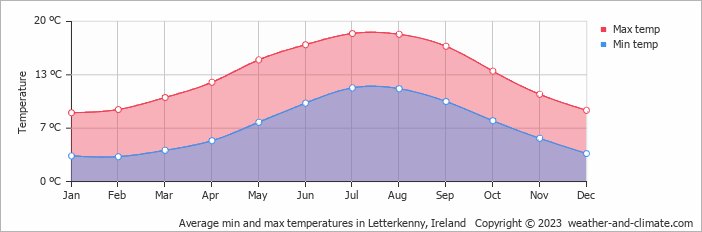
The average annual maximum temperature in Letterkenny, Donegal County, Ireland is 13°C (55°F), with daytime highs ranging from 9°C (48°F) in January to 19°C (66°F) in July. This page covers monthly averages, day-night differences, and how Letterkenny compares to cities worldwide.
Letterkenny Monthly Temperatures
The weather in Letterkenny changes moderately throughout the year, offering enough variation to appreciate each season. Nights are cooler, with lows ranging from 12°C (54°F) to 3°C (37°F).
The chart below illustrates the average maximum day and minimum night temperatures in Letterkenny by month:
From around 4 AM to 6 AM temperatures are at their lowest; by 3 PM they've climbed to their daily peak. July, the warmest month, averages 141 hours of sunshine.
The chart below shows the average temperature throughout the year:
Daily Historical Temperatures
Average high and low temperatures for each day of the month based on long-term records. 50-year average (1976-2025)
Average temperatures in July
Historical Letterkenny Temperatures: 1976-2026
Browse day-by-day temperature records for Letterkenny spanning 51 years. Select any month and year to see actual high and low temperatures recorded on each day.
Temperature: Letterkenny vs Ireland
The map below shows the annual temperature across Ireland. You can also select individual months if you want to compare a specific time of year.
Letterkenny vs World: Temperature Compared
Letterkenny's average annual maximum temperature is 13°C (55°F). To put that in context, here's how it compares to a few well-known destinations:
Rome, Italy averages 20°C (68°F) annually, with reliably warm summers and comfortable winters.
Zermatt, Switzerland averages just 4°C (39°F) annually due to its altitude, with very cold winters and cool summers even at its warmest.
New York City, USA averages 17°C (63°F) a year, with hot humid summers and cold winters that bring regular snowfall.
Tokyo, Japan averages 21°C (70°F) a year, with hot summers, cool winters, and a well-defined cherry blossom spring.
Climate temperature data is typically calculated as a 30-year average. This smooths out year-to-year variability and gives a more reliable picture of what a place is actually like, rather than what happened in any single unusual year.
The readings come from a range of sources, land-based weather stations, ocean buoys, ships, and satellites. That data is collected by weather services around the world, then pooled, quality-checked, and averaged to produce the climate records you see here.
Global average temperatures have risen by around 1.2°C since the pre-industrial era, and the effects are visible across many regions. Winters are milder on average, with fewer frost days and less snow in many parts of the world. Heatwaves are more frequent and more intense, and Europe's summers of 2018, 2019, and 2020 all set records.
Summers are also getting drier in some areas, while winter rainfall has increased in others. This contributies to higher river levels and more flooding. In many countries, spring arrives earlier and autumn lasts longer. It has knock-on effects for wildlife, agriculture, and local ecosystems.
For more on Letterkenny's weather, including monthly rainfall, sunshine hours, and humidity, visit our Letterkenny climate page.
Letterkenny Weather by Month
Pick a month to see the average temperature, rainfall and sunshine in Letterkenny - and find the best time to visit.
Letterkenny 3-Day Forecast
See the full Letterkenny climate overview or explore weather in Ireland.
Popular this month
Where to go in July - average daytime high across popular destinations.
Bucket list
Need travel inspiration? Check out our bucket list articles and be inspired.
 Go to Dingle in Ireland
Dolphins, Whales and breathtaking views. The colorful fishing village Dingle in Ireland has it all and this town is a must for your bucket list.
An Irish adventure like no other in Killarney National Park
Head down to the South West part of the country, County Kerry, to the small town of Killarney. If you want to experience what Ireland is really all about
Horseback riding in Ireland
Ireland is the most ideal place in the world for horseback riding. Combine this with the most hospitable people you will ever encounter and you have an unforgettable dream trip to add to your bucket list.