















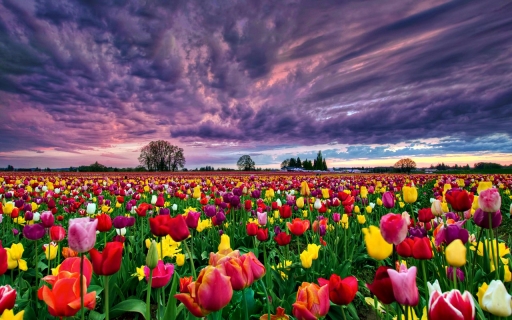
 Flower fields in the Netherlands
The flower fields in The Netherlands are world famous. The red, pink and yellow colors are breathtakingly beautiful and should be on the bucket list.
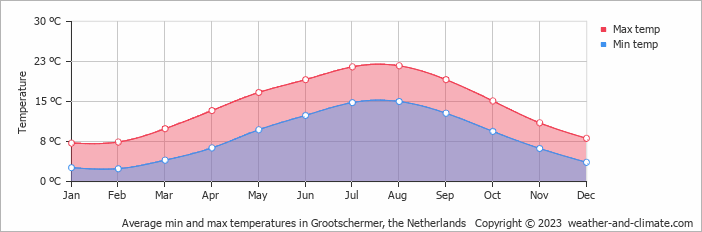
Grootschermer in Noord-Holland, Netherlands sees significant seasonal temperature differences, with daytime highs between 7°C (45°F) in January and 22°C (72°F) in August, averaging 14°C (57°F) annually. Explore the full monthly breakdown below.
The weather in Grootschermer experiences significant differences between warm and cold seasons, with big shifts in temperature. At night, minimum temperatures range from 15°C (59°F) in August to 2°C (36°F) in January.
The chart below illustrates the average maximum day and minimum night temperatures in Grootschermer by month:
Low temperatures are most often recorded between 4 AM and 6 AM, while highs typically occur around 3 PM.
The chart below shows the average temperature throughout the year:
The map below shows the annual temperature across the Netherlands. You can also select individual months if you want to compare a specific time of year.
Grootschermer's average annual maximum temperature is 14°C (57°F). To put that in context, here's how it compares to a few well-known destinations:
Barcelona, Spain has an annual average of around 21°C (70°F), with warm summers and mild, fairly short winters.
Reykjavík, Iceland averages 9°C (48°F) a year, mild summers by Icelandic standards, but cold winters and frequent wind.
San Francisco, USA averages 19°C (66°F) annually, but with little seasonal variation, summers are often cool and foggy, winters mild.
Brisbane, Australia averages 26°C (79°F) a year, with warm winters and hot, humid summers.
Climate temperature data is typically calculated as a 30-year average. This smooths out year-to-year variability and gives a more reliable picture of what a place is actually like, rather than what happened in any single unusual year.
The readings come from a range of sources, land-based weather stations, ocean buoys, ships, and satellites. That data is collected by weather services around the world, then pooled, quality-checked, and averaged to produce the climate records you see here.
For cities and regions with significant elevation, altitude is one of the biggest factors shaping local temperatures. As a rule of thumb, temperatures fall by around 6°C for every 1,000 metres gained, so a city at 2,000 metres will typically be around 12°C cooler than a city at sea level in the same region. Higher ground also tends to see more dramatic day-to-night temperature swings, since thinner air loses heat faster after sunset.
For more on Grootschermer's weather, including monthly rainfall, sunshine hours, and humidity, visit our Grootschermer climate page.
Pick a month to see the average temperature, rainfall and sunshine in Grootschermer - and find the best time to visit.
Temperature Rainfall
See the full Grootschermer climate overview or explore weather in the Netherlands.
Where to go in October - average daytime high across popular destinations.
Noordwijk aan Zee 15°C (59°F) Valkenburg15°C (59°F) Utrecht15°C (59°F) Maastricht16°C (61°F) Rotterdam16°C (61°F) Zandvoort
 15°C (59°F) The Hague16°C (61°F) Amsterdam15°C (59°F)
 Need travel inspiration? Check out our bucket list articles and be inspired.
Flower fields in the Netherlands
The flower fields in The Netherlands are world famous. The red, pink and yellow colors are breathtakingly beautiful and should be on the bucket list.
 Pride in Amsterdam
Nowhere in the world is Pride being celebrated on the water on such a scale as in Amsterdam. It is an unique experience that every person needs to add to his, her or its bucket list.
 The greenest experience of Amsterdam
If you’re looking for an experience of Amsterdam that is rooted in nature, that can help you go outside and get your hands dirty, then these tips are for you.
 Amsterdam Dance Event
ADE is one of the larger festival giants, but you may never have heard of it if you are not an electronic music fan. It last five days and takes place in October.