Chiusanico Temperature by Month
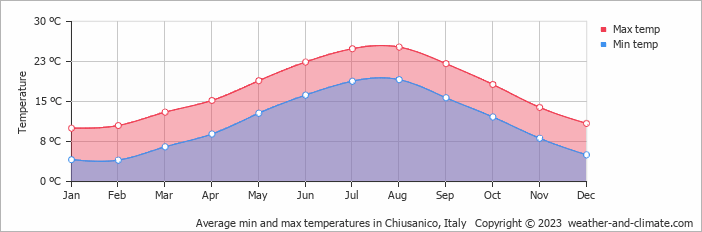
Chiusanico in Liguria, Italy sees significant seasonal temperature differences, with daytime highs between 10°C (50°F) in February and 25°C (77°F) in August, averaging 17°C (63°F) annually. Explore the full monthly breakdown below.
Chiusanico Monthly Temperatures
Depending on the time of the year, temperatures range from comfortable to cold in Chiusanico. At night, minimum temperatures range from 19°C (66°F) in August to 4°C (39°F) in February.
The chart below illustrates the average maximum day and minimum night temperatures in Chiusanico by month:
From around 4 AM to 6 AM temperatures are at their lowest; by 3 PM they've climbed to their daily peak. August, the warmest month, averages 308 hours of sunshine.
The chart below shows the average temperature throughout the year:
Temperature: Chiusanico vs Italy
The map below shows the annual temperature across Italy. You can also select individual months if you want to compare a specific time of year.
 very warm
 warm
warm
 pleasant
 moderate
 cold
cold
 very cold
Chiusanico vs World: Temperature Compared
Chiusanico's average annual maximum temperature is 17°C (63°F). To put that in context, here's how it compares to a few well-known destinations:
Barcelona, Spain has an annual average of around 21°C (70°F), with warm summers and mild, fairly short winters.
On the cooler end, Oslo, Norway averages just 10°C (50°F) annually, with pleasant summers but long, cold winters.
Beijing, China averages 20°C (68°F) annually, but with big seasonal swings — very cold winters and hot summers.
Brisbane, Australia averages 26°C (79°F) a year, with warm winters and hot, humid summers.
Climate temperature data is typically calculated as a 30-year average. This smooths out year-to-year variability and gives a more reliable picture of what a place is actually like, rather than what happened in any single unusual year.
The readings come from a range of sources — land-based weather stations, ocean buoys, ships, and satellites. That data is collected by weather services around the world, then pooled, quality-checked, and averaged to produce the climate records you see here.
Whether a city sits on the coast or deep inland makes a significant difference to its climate. Coastal areas tend to have more stable temperatures year-round — large bodies of water absorb heat slowly in summer and release it gradually in winter, keeping extremes in check. Cities far from the sea don't benefit from that buffer, which is why continental climates tend to have hotter summers and colder winters than their coastal counterparts at the same latitude.
For more on Chiusanico's weather — including monthly rainfall, sunshine hours, and humidity — visit our Chiusanico climate page.


