


















 The 10 most charming villages in France
Discover France's top 10 beautiful villages. From Normandy to the Côte d'Azur, experience quaint squares and cobbled streets. Which one will you visit this summer?
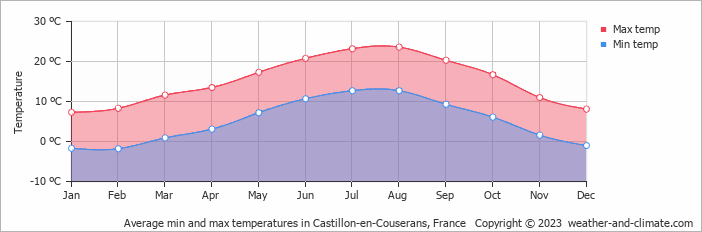
Castillon-en-Couserans in Midi-Pyrénées, France sees significant seasonal temperature differences, with daytime highs between 7°C (45°F) in January and 24°C (75°F) in August, averaging 15°C (59°F) annually. Explore the full monthly breakdown below.
Visitors to Castillon-en-Couserans will encounter a climate influenced by big temperature differences across the year. Nighttime temperatures range from 13°C (55°F) in August to -2°C (28°F) in January.
The chart below illustrates the average maximum day and minimum night temperatures in Castillon-en-Couserans by month:
Daily lows are most common between 4 AM and 6 AM. By 3 PM temperatures reach their daily high, driven by peak solar heating.
The chart below shows the average temperature throughout the year:
The map below shows the annual temperature across France. You can also select individual months if you want to compare a specific time of year.
Castillon-en-Couserans's average annual maximum temperature is 15°C (59°F). To put that in context, here's how it compares to a few well-known destinations:
Seville, Spain averages 23°C (73°F) a year, one of the warmer cities in Western Europe, with long hot summers.
On the cooler end, Oslo, Norway averages just 10°C (50°F) annually, with pleasant summers but long, cold winters.
Seoul, South Korea averages 18°C (64°F) a year, with four clear seasons, cold winters, and hot humid summers.
Brisbane, Australia averages 26°C (79°F) a year, with warm winters and hot, humid summers.
Climate temperature data is typically calculated as a 30-year average. This smooths out year-to-year variability and gives a more reliable picture of what a place is actually like, rather than what happened in any single unusual year.
The readings come from a range of sources, land-based weather stations, ocean buoys, ships, and satellites. That data is collected by weather services around the world, then pooled, quality-checked, and averaged to produce the climate records you see here.
Seasonal temperature shifts influence more than just how warm it feels, they also drive changes in rainfall, cloud cover, and wind patterns throughout the year.
Warmer air holds more moisture, which tends to mean heavier or more frequent rain during the warmer months. When temperatures drop in winter, any precipitation that does fall is more likely to come as snow or sleet, though in Castillon-en-Couserans this rarely lasts long on the ground.
For more on Castillon-en-Couserans's weather, including monthly rainfall, sunshine hours, and humidity, visit our Castillon-en-Couserans climate page.
Pick a month to see the average temperature, rainfall and sunshine in Castillon-en-Couserans - and find the best time to visit.
Temperature Rainfall
See the full Castillon-en-Couserans climate overview or explore weather in France.
Where to go in October - average daytime high across popular destinations.
Need travel inspiration? Check out our bucket list articles and be inspired.
The 10 most charming villages in France
Discover France's top 10 beautiful villages. From Normandy to the Côte d'Azur, experience quaint squares and cobbled streets. Which one will you visit this summer?
 An alternative way to discover Paris
From street art, vintage shops, vegetarian cafes, to amazing cultural events, Paris has much to offer for the creative traveler. An overview of sights that you must see if you want to visit this city in an alternative way.
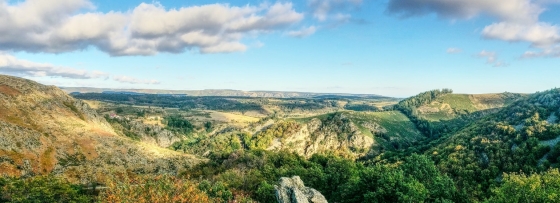 Nature is allowed to take its course in the Ardeche
The Ardèche is France at its most beautiful. The authentic villages and breathtaking mountainous landscapes are one of the main reasons. he climate in Ardèche is very pleasant. Temperatures are high during summer and it is often very sunny.

 Explore the natural wonders of Corsica
Corsica offers an abundance of incredible natural wonders to explore. This stunning Mediterranean island is a paradise for outdoor enthusiasts and nature lovers alike.