Capitólio Temperature by Month
Capitólio, Minas Gerais, Brazil has a consistently comfortable climate year-round, with daytime highs averaging 28°C (82°F). Below you'll find a full monthly breakdown and a comparison with cities worldwide.
Capitólio Monthly Temperatures
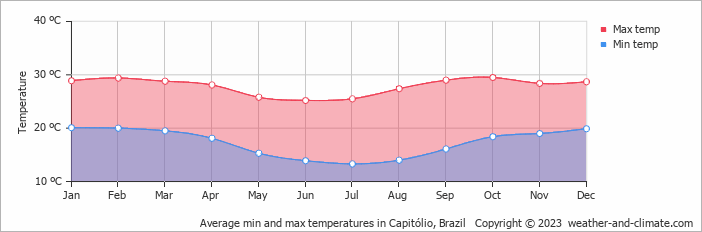
Year-round, Capitólio experiences a consistently comfortable climate. Maximum daytime temperatures range from a comfortable 30°C (86°F) in October to a comfortable 25°C (77°F) in the coolest month, June. Nighttime temperatures range from 18°C (64°F) in October to 13°C (55°F) in June.
The chart below illustrates the average maximum day and minimum night temperatures in Capitólio by month:
The coldest point of the day usually falls between 4 AM and 6 AM, with temperatures peaking around 3 PM.
The chart below shows the average temperature throughout the year:
Temperature: Capitólio vs Brazil
The map below shows the annual temperature across Brazil. You can also select individual months if you want to compare a specific time of year.
Capitólio vs World: Temperature Compared
Capitólio's average annual maximum temperature is 28°C (82°F). To put that in context, here's how it compares to a few well-known destinations:
Lisbon, Portugal averages 21°C (70°F) annually, warm summers, mild winters, and rain mainly in the cooler months.
Queenstown, New Zealand averages 10°C (50°F) annually, remember seasons are flipped, so its coldest months fall in June and July.
Boston, USA averages 16°C (61°F) annually, with four distinct seasons and cold winters that rival northern Europe.
Tokyo, Japan averages 21°C (70°F) a year, with hot summers, cool winters, and a well-defined cherry blossom spring.
Climate temperature data is typically calculated as a 30-year average. This smooths out year-to-year variability and gives a more reliable picture of what a place is actually like, rather than what happened in any single unusual year.
The readings come from a range of sources, land-based weather stations, ocean buoys, ships, and satellites. That data is collected by weather services around the world, then pooled, quality-checked, and averaged to produce the climate records you see here.
For cities and regions with significant elevation, altitude is one of the biggest factors shaping local temperatures. As a rule of thumb, temperatures fall by around 6°C for every 1,000 metres gained, so a city at 2,000 metres will typically be around 12°C cooler than a city at sea level in the same region. Higher ground also tends to see more dramatic day-to-night temperature swings, since thinner air loses heat faster after sunset.
For more on Capitólio's weather, including monthly rainfall, sunshine hours, and humidity, visit our Capitólio climate page.
Capitólio Weather by Month
Pick a month to see the average temperature, rainfall and sunshine in Capitólio - and find the best time to visit.
Capitólio 3-Day Forecast
Temperature Rainfall
See the full Capitólio climate overview or explore weather in Brazil.
Popular this month
Where to go in July - average daytime high across popular destinations.
Bucket list
Need travel inspiration? Check out our bucket list articles and be inspired.
 The 10 most alternative cities in South America
Discover South America's top 10 alternative cities! From Valparaíso's vibrant streets to La Paz's high-altitude charm and Medellín's innovative spirit.
 The 5 most tranquil retreats in the Amazon Rainforest, Brazil
Discover top sustainable lodges in the Amazon. Enjoy unique wildlife, eco-friendly stays, and immersive experiences at Anavilhanas, Cristalino, and more.
An alternative way to discover Rio de Janeiro
Don't feel like seeing the traditional tourist sights in Rio de Janeiro? We have made an overview of the sights in Rio de Janeiro that you must see if you want to visit Rio in an alternative way.
Iguazu Falls
Iguazu Falls are among the largest waterfalls on earth. You will be speechless when you see this miracle of mother nature. They are included in the World Heritage List and have also been named one of the seven wonders of the world.