Bandung Temperature by Month
The average annual maximum temperature in Bandung, West Java, Indonesia is 28°C (82°F), with little variation between seasons. This page covers monthly averages, day-night differences, and how Bandung compares to cities worldwide.
Bandung Monthly Temperatures
Bandung enjoys a stable climate with temperatures staying pretty much the same throughout the year. Maximum daytime temperatures range from a comfortable 27°C (81°F) in January to a comfortable 29°C (84°F) in September. Nights are consistently cool, with lows between 19°C (66°F) and 18°C (64°F).
The chart below illustrates the average maximum day and minimum night temperatures in Bandung by month:
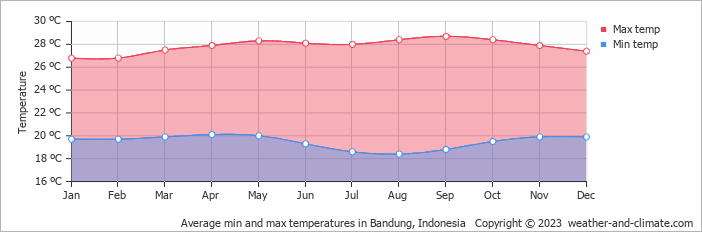
The coldest point of the day usually falls between 4 AM and 6 AM, with temperatures peaking around 3 PM. September, the city's warmest month, gets 211 hours of sunshine.
The chart below shows the average temperature throughout the year:
Daily Historical Temperatures
Average high and low temperatures for each day of the month based on long-term records. 48-year average (1976-2025)
Average temperatures in July
Historical Bandung Temperatures: 1976-2026
Browse day-by-day temperature records for Bandung spanning 51 years. Select any month and year to see actual high and low temperatures recorded on each day.
Temperature: Bandung vs Indonesia
The map below shows the annual temperature across Indonesia. You can also select individual months if you want to compare a specific time of year.
Bandung vs World: Temperature Compared
Bandung's average annual maximum temperature is 28°C (82°F). To put that in context, here's how it compares to a few well-known destinations:
Lisbon, Portugal averages 21°C (70°F) annually, warm summers, mild winters, and rain mainly in the cooler months.
On the cooler end, Oslo, Norway averages just 10°C (50°F) annually, with pleasant summers but long, cold winters.
Osaka, Japan averages 22°C (72°F) annually, with hot humid summers, mild winters, and pleasant spring and autumn seasons.
Tokyo, Japan averages 21°C (70°F) a year, with hot summers, cool winters, and a well-defined cherry blossom spring.
Climate temperature data is typically calculated as a 30-year average. This smooths out year-to-year variability and gives a more reliable picture of what a place is actually like, rather than what happened in any single unusual year.
The readings come from a range of sources, land-based weather stations, ocean buoys, ships, and satellites. That data is collected by weather services around the world, then pooled, quality-checked, and averaged to produce the climate records you see here.
Whether a city sits on the coast or deep inland makes a significant difference to its climate. Coastal areas tend to have more stable temperatures year-round, large bodies of water absorb heat slowly in summer and release it gradually in winter, keeping extremes in check. Cities far from the sea don't benefit from that buffer, which is why continental climates tend to have hotter summers and colder winters than their coastal counterparts at the same latitude.
For more on Bandung's weather, including monthly rainfall, sunshine hours, and humidity, visit our Bandung climate page.
Bandung Weather by Month
Pick a month to see the average temperature, rainfall and sunshine in Bandung - and find the best time to visit.
Bandung 3-Day Forecast
See the full Bandung climate overview or explore weather in Indonesia.
Popular this month
Where to go in July - average daytime high across popular destinations.
Bucket list
Need travel inspiration? Check out our bucket list articles and be inspired.
 10 Hidden gems in Asia you need to visit
Explore 10 hidden gems in Asia offering authentic experiences, from pristine beaches and remote islands to cultural treks and peaceful mountain villages.
The ultimate guide to Ubud – everything you need to know to escape the crowds
There is a way to experience Ubud in a fantastic less crowded way and this article will be your guide how to do that. Find the best places to stay, where to eat and much more.
Top 5 hidden gem islands in Indonesia
Discover Indonesia's secret islands: pristine beaches, rich history, and vibrant culture await beyond Bali and Java. Dive into untouched paradise.
Six Organic Farms & Farmstays in Indonesia
We've compiled a list of organic farms in Indonesia that have a positive impact on their communities - they could use your help during this pandemic.