Balgue Temperature by Month
Balgue in Rivas Region, Nicaragua enjoys a stable climate, with daytime temperatures staying close to 29°C (84°F) throughout the year. Explore the full monthly breakdown below.
Balgue Monthly Temperatures
Balgue enjoys a stable climate with temperatures staying pretty much the same throughout the year. Maximum daytime temperatures range from a comfortable 29°C (84°F) in January to a very warm 30°C (86°F) in April. Nights are consistently cool, with lows between 26°C (79°F) and 24°C (75°F).
The chart below illustrates the average maximum day and minimum night temperatures in Balgue by month:
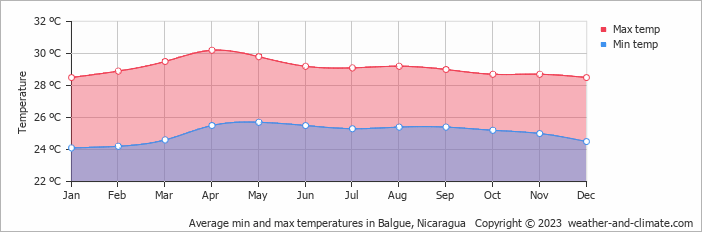
Daily lows are most common between 4 AM and 6 AM. By 3 PM temperatures reach their daily high, driven by peak solar heating. April, the warmest month of the year, receives 220 hours of sunshine.
The chart below shows the average temperature throughout the year:
Daily Historical Temperatures
30-year average (1986-2025)
Average high and low temperatures for each day of the month based on long-term records.
Average temperatures in June
Historical Balgue Temperatures: 1976-2026
Browse day-by-day temperature records for Balgue spanning 51 years. Select any month and year to see actual high and low temperatures recorded on each day.
Temperature: Balgue vs Nicaragua
The map below shows the annual temperature across Nicaragua. You can also select individual months if you want to compare a specific time of year.
 very warm
 warm
warm
 pleasant
 moderate
 cold
cold
 very cold
Balgue vs World: Temperature Compared
Balgue's average annual maximum temperature is 29°C (84°F). To put that in context, here's how it compares to a few well-known destinations:
Lisbon, Portugal averages 21°C (70°F) annually — warm summers, mild winters, and rain mainly in the cooler months.
Toronto, Canada averages 13°C (55°F) annually, with cold snowy winters balanced by genuinely warm summers.
Buenos Aires, Argentina averages 23°C (73°F) a year, with hot summers and mild winters — and seasons reversed compared to Europe.
Tokyo, Japan averages 21°C (70°F) a year, with hot summers, cool winters, and a well-defined cherry blossom spring.
Climate temperature data is typically calculated as a 30-year average. This smooths out year-to-year variability and gives a more reliable picture of what a place is actually like, rather than what happened in any single unusual year.
The readings come from a range of sources — land-based weather stations, ocean buoys, ships, and satellites. That data is collected by weather services around the world, then pooled, quality-checked, and averaged to produce the climate records you see here.
For cities and regions with significant elevation, altitude is one of the biggest factors shaping local temperatures. As a rule of thumb, temperatures fall by around 6°C for every 1,000 metres gained — so a city at 2,000 metres will typically be around 12°C cooler than a city at sea level in the same region. Higher ground also tends to see more dramatic day-to-night temperature swings, since thinner air loses heat faster after sunset.
For more on Balgue's weather — including monthly rainfall, sunshine hours, and humidity — visit our Balgue climate page.