















 The 10 most alternative cities in South America
Discover South America's top 10 alternative cities! From Valparaíso's vibrant streets to La Paz's high-altitude charm and Medellín's innovative spirit.
Azul, Buenos Aires Province, Argentina has an average annual maximum temperature of 22°C (72°F), ranging from 14°C (57°F) in July to 29°C (84°F) in January. Below you'll find a full monthly breakdown and a comparison with cities worldwide.
Visitors to Azul will encounter a climate influenced by big temperature differences across the year. Nighttime temperatures range from 15°C (59°F) in January to 3°C (37°F) in July.
The chart below illustrates the average maximum day and minimum night temperatures in Azul by month:
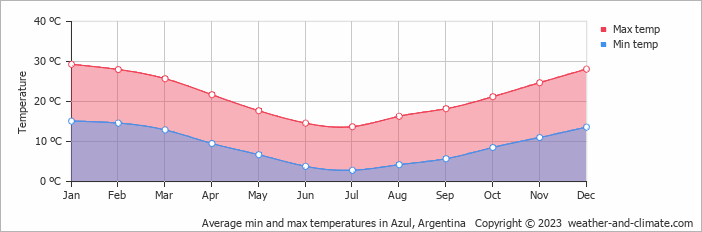
The coldest point of the day usually falls between 4 AM and 6 AM, with temperatures peaking around 3 PM.
The chart below shows the average temperature throughout the year:
The map below shows the annual temperature across Argentina. You can also select individual months if you want to compare a specific time of year.
Azul's average annual maximum temperature is 22°C (72°F). To put that in context, here's how it compares to a few well-known destinations:
Lisbon, Portugal averages 21°C (70°F) annually, warm summers, mild winters, and rain mainly in the cooler months.
Interlaken, Switzerland averages 8°C (46°F) a year, with cold winters and cool summers thanks to its Alpine setting.
Shanghai, China averages 21°C (70°F) a year, with warm summers, mild winters, and a noticeable spring and autumn.
Melbourne, Australia averages 20°C (68°F) annually, known for unpredictable weather, with four seasons sometimes happening in one day.
Climate temperature data is typically calculated as a 30-year average. This smooths out year-to-year variability and gives a more reliable picture of what a place is actually like, rather than what happened in any single unusual year.
The readings come from a range of sources, land-based weather stations, ocean buoys, ships, and satellites. That data is collected by weather services around the world, then pooled, quality-checked, and averaged to produce the climate records you see here.
Global average temperatures have risen by around 1.2°C since the pre-industrial era, and the effects are visible across many regions. Winters are milder on average, with fewer frost days and less snow in many parts of the world. Heatwaves are more frequent and more intense, and Europe's summers of 2018, 2019, and 2020 all set records.
Summers are also getting drier in some areas, while winter rainfall has increased in others. This contributies to higher river levels and more flooding. In many countries, spring arrives earlier and autumn lasts longer. It has knock-on effects for wildlife, agriculture, and local ecosystems.
For more on Azul's weather, including monthly rainfall, sunshine hours, and humidity, visit our Azul climate page.
Pick a month to see the average temperature, rainfall and sunshine in Azul - and find the best time to visit.
Temperature Rainfall
See the full Azul climate overview or explore weather in Argentina.
Where to go in October - average daytime high across popular destinations.
Córdoba 25°C (77°F) Mendoza
 24°C (75°F) Salta
 23°C (73°F) Villa Carlos Paz23°C (73°F) Buenos Aires23°C (73°F) Mar del Plata18°C (64°F) San Carlos de Bariloche11°C (52°F) San Martín de los Andes
 11°C (52°F)
 Need travel inspiration? Check out our bucket list articles and be inspired.
The 10 most alternative cities in South America
Discover South America's top 10 alternative cities! From Valparaíso's vibrant streets to La Paz's high-altitude charm and Medellín's innovative spirit.
 Warm Days, Cool Nights: 8 Destinations With the Perfect Day-Night Temperature
Prefer warm sunny days but cool evenings? Compare eight destinations with daytime temperatures of around 25–30°C, cooler nights, low rainfall and plenty of sunshine.
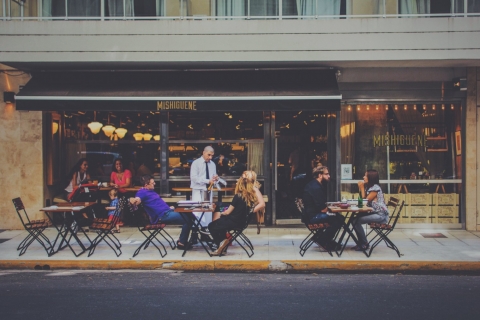 Be amazed by Buenos Aires
The city of beautiful museums, cute streets, green parks, lots of good food, interesting local neighborhoods and impressive historical buildings.
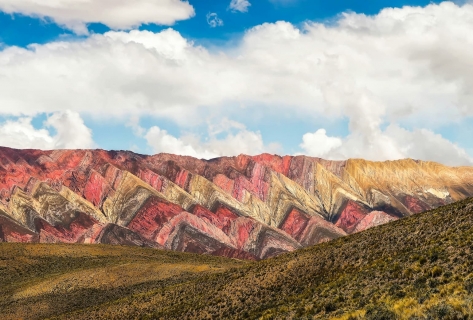 Argentina in November: Where to Go for the Best Weather
Compare November weather in Mendoza, Buenos Aires, Cafayate, Bariloche and Ushuaia to find Argentina's warmest, sunniest and driest places.