
















 The Li River: A Journey Through China’s Most Breathtaking Landscape
Explore the Li River, China's breathtaking landscape with majestic mountains, serene waters, and picturesque views. A must-see for every traveler.
Sunshine plays a big role in understanding the climate of a city. This page shows the total number of hours of direct sunlight per month and the average hours per day in Pulandian, China. These averages rely on historical data collected over 30 years, from 1990 to 2020.
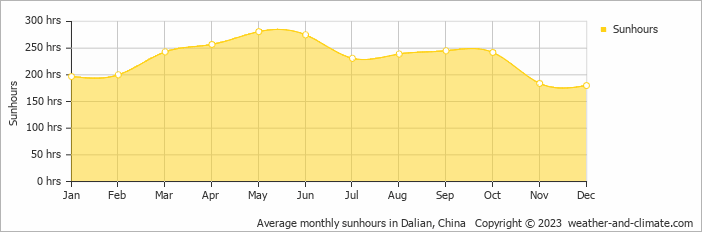
Pulandian Nusa Penida experiences both sunny and cloudy or rainy periods, with some seasonal variation. It receives approximately 281 hours of sunshine in May and 180 hours in December, contributing to a total annual sunshine amount of 2774 hours.
This means you can enjoy sunny spells year-round. May sees up to 9.4 hours of daily sunshine, perfect for a sunny trip. December, the least sunny month, still offers a generous 6.0 hours of sun despite this cloudier / rainier time of the year.
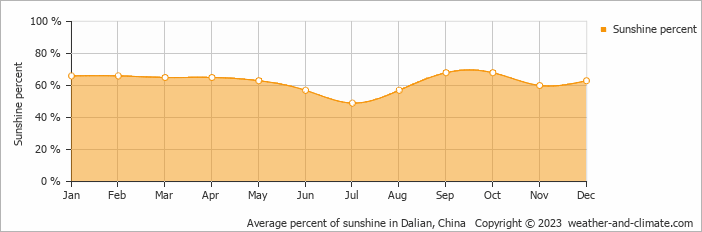
On average the sun shines 68% of the time during the day in September, the highest percentage of any month. July has the lowest percentage at 49%.
Pulandian enjoys an average of 2774 hours of sunshine annually. Let’s compare this with some popular tourist destinations:
The city of Rome, Italy, experiences 2470 hours of sunshine annually, adding to its charm as a year-round tourist destination.
In contrast, Juneau, Alaska, receives only about 1523 hours of sunshine per year and is known for its very short days in winter and frequently overcast conditions.
Osaka, Japan, experiences 2010 hours of sunshine annually, with bright, sunny weather in spring and autumn.
In Tokyo, Japan, the average annual sunshine is 1930 hours, with sunny periods between rainy seasons.
August, Pulandian’s wettest month, receives 156 mm (6.1 in) of rainfall and has a maximum daytime temperature of 30°C (86°F). During the driest month January you can expect a temperature of 0°C (32°F).
For more detailed insights into the city’s temperatures, check out our Temperature page. To explore more about precipitation patterns, visit our Pulandian Precipitation page.
Pick a month to see the average temperature, rainfall and sunshine in Pulandian - and find the best time to visit.
Temperature Rainfall Sunshine Humidity
See the full Pulandian climate overview or explore weather in China.
Where to go in October - average daytime high across popular destinations.
Guangzhou 30°C (86°F) Shenzhen29°C (84°F) Hangzhou25°C (77°F) Shanghai24°C (75°F) Chengdu
 22°C (72°F) Xi'an
 21°C (70°F) Beijing
 21°C (70°F) Qingdao21°C (70°F)
 Need travel inspiration? Check out our bucket list articles and be inspired.
The Li River: A Journey Through China’s Most Breathtaking Landscape
Explore the Li River, China's breathtaking landscape with majestic mountains, serene waters, and picturesque views. A must-see for every traveler.
 Go to China's Zhangjiajie National Park with the highest, the fastest, largest-loaded outdoor elevator in the world
You won't find this unique landscape anywhere else in the world. Thousands of floating mountains overgrown with trees at the top dominate this fairy tale landscape.
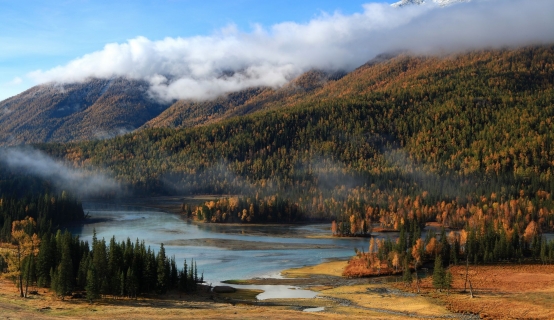 Go to Xinjiang in China
In Xinjiang you get to see a mix of East and Central Asia. An experience that you might want to add to your bucket list. You can travel through the province as if you are following an ancient silk route.
 Mount Kailash
The best time for a Kailash tour/trekking is from mid-May to mid-October when the temperature is most pleasant. It is warm, dry and sunny in that period.