Port-Camargue Sunshine Hours by Month
Sunshine plays a big role in understanding the climate of a city. This page shows the total number of hours of direct sunlight per month and the average hours per day in Port-Camargue, Languedoc-Roussillon, France. These averages rely on historical data collected over 30 years, from 1990 to 2020.
Monthly hours of sunshine
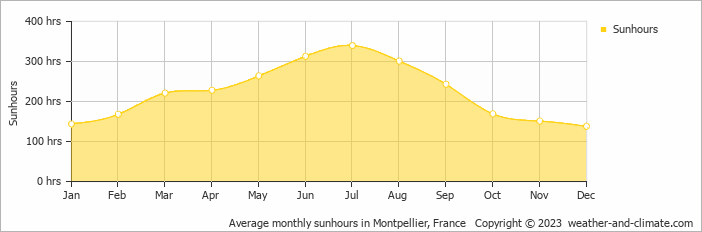
Those who love seasonal contrasts will appreciate Port-Camargue. Expect long, bright days with 340 hours in July and darker periods with just 138 hours in December. The total annual amount of sun is 2680 hours.
Daily hours of sunshine
This means the city can be enjoyed more throughout the sunniest month of July under a blue sky, with approximately 11.3 hours of sunshine daily. In contrast, the city experiences much darker days in December, with only 4.6 hours of sunlight per day.
Port-Camargue vs Major Cities: Sunshine Compared
Port-Camargue enjoys an average of 2680 hours of sunshine annually. Let’s compare this with some popular tourist destinations:
The city of Rome, Italy, experiences 2470 hours of sunshine annually, adding to its charm as a year-round tourist destination.
In contrast, Reykjavík, Iceland, receives only about 1330 hours of sunshine per year, known for its frequently overcast and rainy skies.
Toronto, Canada, sees around 2071 hours of sunshine each year, with especially long, bright summer days.
Melbourne, Australia, has 2380 hours of sunshine annually, with its famous “four seasons in a day” weather pattern.
Related Climate Data for Port-Camargue
October, Port-Camargue’s wettest month, receives 16 mm (0.6 in) of rainfall and has a maximum daytime temperature of 21°C (70°F). During the driest month July you can expect a temperature of 27°C (81°F).
For more detailed insights into the city’s temperatures, check out our Temperature page. To explore more about precipitation patterns, visit our Port-Camargue Precipitation page.
Port-Camargue Weather by Month
Pick a month to see the average temperature, rainfall and sunshine in Port-Camargue - and find the best time to visit.




Port-Camargue 3-Day Forecast
Temperature Rainfall Sunshine Humidity
See the full Port-Camargue climate overview or explore weather in France.
Popular this month
Where to go in September - average daytime high across popular destinations.














Bucket list
Need travel inspiration? Check out our bucket list articles and be inspired.
 The 10 most charming villages in France
Discover France's top 10 beautiful villages. From Normandy to the Côte d'Azur, experience quaint squares and cobbled streets. Which one will you visit this summer?
An alternative way to discover Paris
From street art, vintage shops, vegetarian cafes, to amazing cultural events, Paris has much to offer for the creative traveler. An overview of sights that you must see if you want to visit this city in an alternative way.
Nature is allowed to take its course in the Ardeche
The Ardèche is France at its most beautiful. The authentic villages and breathtaking mountainous landscapes are one of the main reasons. he climate in Ardèche is very pleasant. Temperatures are high during summer and it is often very sunny.
 Explore the natural wonders of Corsica
Corsica offers an abundance of incredible natural wonders to explore. This stunning Mediterranean island is a paradise for outdoor enthusiasts and nature lovers alike.