
















 The 10 most alternative cities in South America
Discover South America's top 10 alternative cities! From Valparaíso's vibrant streets to La Paz's high-altitude charm and Medellín's innovative spirit.
In climate discussions, the hours of sunlight reveal much about a location. This page shows the total number of hours of direct sunlight per month and the average hours per day in Maipú, Mendoza Province, Argentina. The numbers reflect climate data gathered over a 30-year period, from 1990 to 2020.
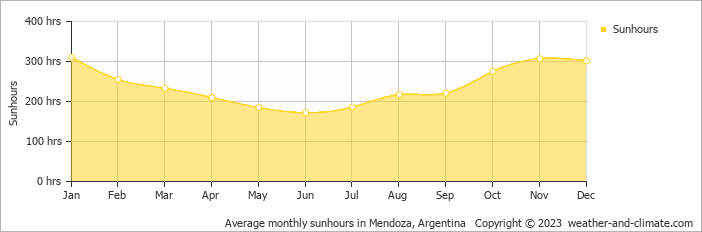
Those who love seasonal contrasts will appreciate Maipú. Expect long, bright days with 311 hours in January and darker periods with just 172 hours in June. The total annual amount of sun is 2874 hours.
Seasonal changes in sunshine hours are quite obvious in Maipú. While January receives considerable daily sunshine with up to 10.4 hours, June marks the darkest time of the year, where sunshine is scarce with only 5.7 hours of sunlight per day.
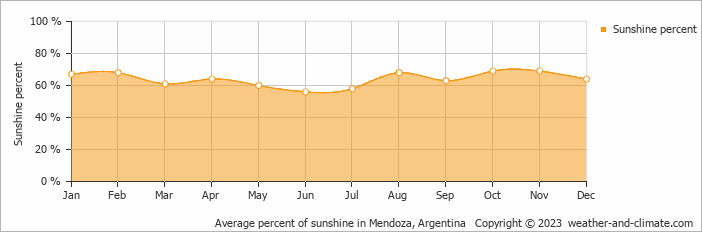
On average the sun shines 69% of the time during the day in October, the highest percentage of any month. June has the lowest percentage at 56%.
Maipú enjoys an average of 2874 hours of sunshine annually. Let’s compare this with some popular tourist destinations:
Seville, Spain, enjoys an impressive 2920 hours of sunshine per year, making it an ideal destination even in winter.
In contrast, London, UK, receives only about 1659 hours of sunshine per year, known for its frequently overcast and rainy skies.
Beijing, China, has 2505 hours of sunshine annually, with clear, sunny days in winter.
Perth, Australia, enjoys 3180 hours of sunshine annually, the highest among major Australian cities.
March, Maipú’s wettest month, receives 72 mm (2.8 in) of rainfall and has a maximum daytime temperature of 27°C (81°F). During the driest month July you can expect a temperature of 14°C (57°F).
For more detailed insights into the city’s temperatures, check out our Temperature page. To explore more about precipitation patterns, visit our Maipú Precipitation page.
Pick a month to see the average temperature, rainfall and sunshine in Maipú - and find the best time to visit.
Temperature Rainfall Sunshine Humidity Wind Speed
See the full Maipú climate overview or explore weather in Argentina.
Where to go in October - average daytime high across popular destinations.
Córdoba 25°C (77°F) Mendoza
 24°C (75°F) Salta
 23°C (73°F) Villa Carlos Paz23°C (73°F) Buenos Aires23°C (73°F) Mar del Plata18°C (64°F) San Carlos de Bariloche11°C (52°F) San Martín de los Andes
 11°C (52°F)
 Need travel inspiration? Check out our bucket list articles and be inspired.
The 10 most alternative cities in South America
Discover South America's top 10 alternative cities! From Valparaíso's vibrant streets to La Paz's high-altitude charm and Medellín's innovative spirit.
 Warm Days, Cool Nights: 8 Destinations With the Perfect Day-Night Temperature
Prefer warm sunny days but cool evenings? Compare eight destinations with daytime temperatures of around 25–30°C, cooler nights, low rainfall and plenty of sunshine.
 Be amazed by Buenos Aires
The city of beautiful museums, cute streets, green parks, lots of good food, interesting local neighborhoods and impressive historical buildings.
 Argentina in November: Where to Go for the Best Weather
Compare November weather in Mendoza, Buenos Aires, Cafayate, Bariloche and Ushuaia to find Argentina's warmest, sunniest and driest places.