















 The 10 most alternative cities in South America
Discover South America's top 10 alternative cities! From Valparaíso's vibrant streets to La Paz's high-altitude charm and Medellín's innovative spirit.
To truly understand a climate, we must look at its sunshine. This page shows the total number of hours of direct sunlight per month and the average hours per day in La Bolsa, Chubut, Argentina. The numbers reflect climate data gathered over a 30-year period, from 1990 to 2020.
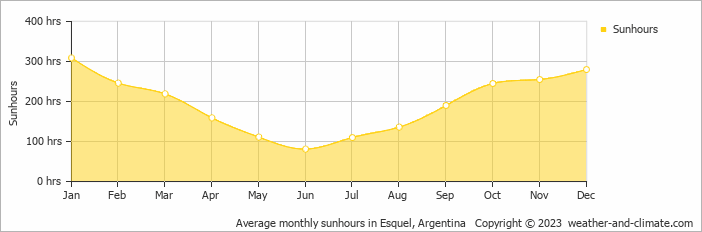
Seasonal sunshine in La Bolsa varies. It peaks at 309 hours in January and drops to 81 hours in June. The total annual amount of sun is 2341 hours.
Seasonal changes in sunshine hours are quite obvious in La Bolsa. While January receives considerable daily sunshine with up to 10.3 hours, June marks the darkest time of the year, where sunshine is scarce with only 2.7 hours of sunlight per day.
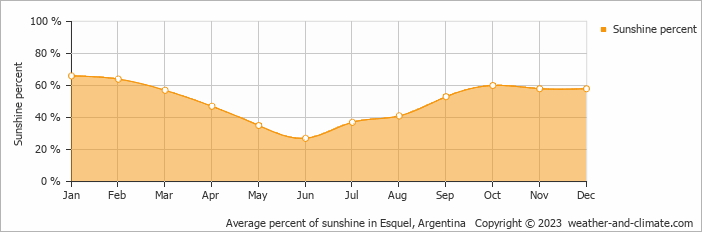
On average the sun shines 66% of the time during the day in January, the highest percentage of any month. June has the lowest percentage at 27%.
La Bolsa enjoys an average of 2341 hours of sunshine annually. Let’s compare this with some popular tourist destinations:
In Lisbon, Portugal, there are approximately 2801 hours of sunshine annually, highlighting its warm and sunny Mediterranean climate.
In contrast, Juneau, Alaska, receives only about 1523 hours of sunshine per year and is known for its very short days in winter and frequently overcast conditions.
The climate in San Francisco, USA, includes 3072 hours of sunshine annually, thanks to its mild coastal weather.
Melbourne, Australia, has 2380 hours of sunshine annually, with its famous “four seasons in a day” weather pattern.
June, La Bolsa’s wettest month, receives 63 mm (2.5 in) of snow/rainfall and has a maximum daytime temperature of 5°C (41°F). During the driest month February you can expect a temperature of 20°C (68°F).
For more detailed insights into the city’s temperatures, check out our Temperature page. To explore more about precipitation patterns, visit our La Bolsa Precipitation page.
Pick a month to see the average temperature, rainfall and sunshine in La Bolsa - and find the best time to visit.
Temperature Rainfall Sunshine Humidity
See the full La Bolsa climate overview or explore weather in Argentina.
Where to go in October - average daytime high across popular destinations.
Córdoba 25°C (77°F) Mendoza
 24°C (75°F) Salta
 23°C (73°F) Villa Carlos Paz23°C (73°F) Buenos Aires23°C (73°F) Mar del Plata18°C (64°F) San Carlos de Bariloche11°C (52°F) San Martín de los Andes
 11°C (52°F)
 Need travel inspiration? Check out our bucket list articles and be inspired.
The 10 most alternative cities in South America
Discover South America's top 10 alternative cities! From Valparaíso's vibrant streets to La Paz's high-altitude charm and Medellín's innovative spirit.
 Warm Days, Cool Nights: 8 Destinations With the Perfect Day-Night Temperature
Prefer warm sunny days but cool evenings? Compare eight destinations with daytime temperatures of around 25–30°C, cooler nights, low rainfall and plenty of sunshine.
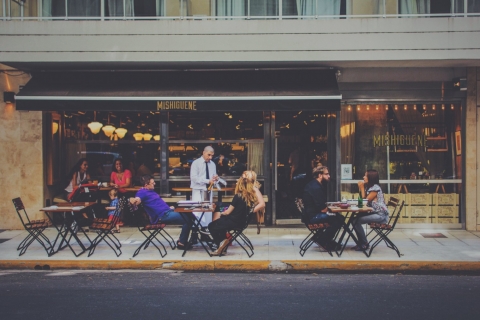 Be amazed by Buenos Aires
The city of beautiful museums, cute streets, green parks, lots of good food, interesting local neighborhoods and impressive historical buildings.
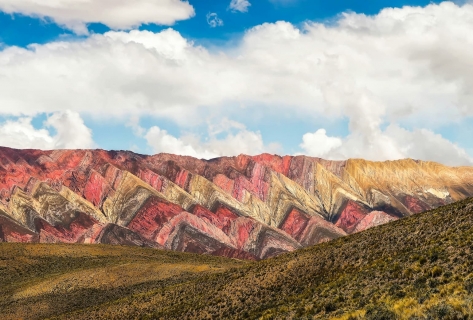 Argentina in November: Where to Go for the Best Weather
Compare November weather in Mendoza, Buenos Aires, Cafayate, Bariloche and Ushuaia to find Argentina's warmest, sunniest and driest places.