Kumara Sunshine Hours by Month
To truly understand a climate, we must look at its sunshine. This page shows the total number of hours of direct sunlight per month and the average hours per day in Kumara, West Coast, New Zealand. The figures are based on a 30-year period (1990–2020) to provide a reliable average.
Monthly hours of sunshine
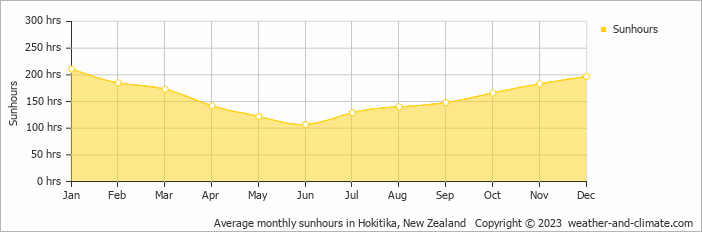
Those who love seasonal contrasts will appreciate Kumara. Expect long, bright days with 211 hours in January and darker periods with just 107 hours in June. The total annual amount of sun is 1903 hours.
Daily hours of sunshine
This means the city can be enjoyed more throughout the sunniest month of January under a blue sky, with approximately 7.0 hours of sunshine daily. In contrast, the city experiences much darker days in June, with only 3.6 hours of sunlight per day.
Kumara vs Major Cities: Sunshine Compared
Kumara enjoys an average of 1903 hours of sunshine annually. Let’s compare this with some popular tourist destinations:
The city of Rome, Italy, experiences 2470 hours of sunshine annually, adding to its charm as a year-round tourist destination.
Manchester, UK, experiences just around 1420 hours of sunshine annually.
In Shanghai, China, the annual average sunshine is 1780 hours, with cloudier weather in summer.
Adelaide, Australia, enjoys 2770 hours of sunshine annually, with long, sunny summers.
Related Climate Data for Kumara
October, Kumara’s wettest month, receives 218 mm (8.6 in) of rainfall and has a maximum daytime temperature of 15°C (59°F). During the driest month July you can expect a temperature of 11°C (52°F).
For more detailed insights into the city’s temperatures, check out our Temperature page. To explore more about precipitation patterns, visit our Kumara Precipitation page.
Kumara Weather by Month
Pick a month to see the average temperature, rainfall and sunshine in Kumara - and find the best time to visit.

Kumara 3-Day Forecast
Temperature Rainfall Sunshine Humidity Wind Speed Water Temp
See the full Kumara climate overview or explore weather in New Zealand.
Popular this month
Where to go in September - average daytime high across popular destinations.
 Paihia
 17°C (63°F) Auckland
 17°C (63°F) Rotorua15°C (59°F) Christchurch
 15°C (59°F) Wellington14°C (57°F) Nelson14°C (57°F) Taupo14°C (57°F) Queenstown6°C (43°F)
















Bucket list
Need travel inspiration? Check out our bucket list articles and be inspired.
The Tongariro Crossing in New Zealand
It is called the most beautiful walk in New Zealand, the Tongariro Crossing. The official hiking season starts late October until end of April.
White-water sledge and raft in Rotorua
We recommend to white-water sledge and raft in Rotorua in summer (January, February) when the Glacier melt fills the rivers. This is the best time.