Cabinda Sunshine Hours by Month
The amount of sunshine is fundamental to comprehending a place's climate. This page shows the total number of hours of direct sunlight per month and the average hours per day in Cabinda, Angola. These values are calculated using 30 years of data (1990–2020) to ensure accuracy.
Monthly hours of sunshine
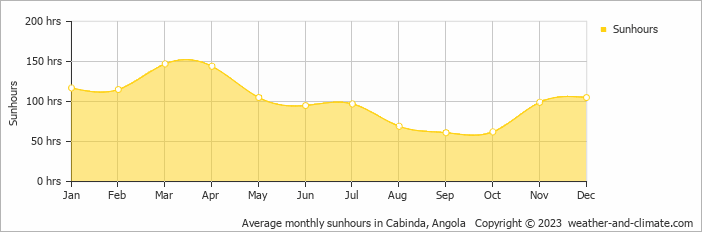
Those who love seasonal contrasts will appreciate Cabinda. Expect long, bright days with 147 hours in March and darker periods with just 61 hours in September. The total annual amount of sun is 1216 hours.
Daily hours of sunshine
In Cabinda, summer days are longer and more sunny, with daily sunshine hours peaking at 4.9 hours in March. As the darker season arrives, the brightness of the sun becomes less. September sees a soft sun for only 2.0 hours per day.
Cabinda vs Major Cities: Sunshine Compared
Cabinda enjoys an average of 1216 hours of sunshine annually. Let’s compare this with some popular tourist destinations:
The city of Rome, Italy, experiences 2470 hours of sunshine annually, adding to its charm as a year-round tourist destination.
In contrast, London, UK, receives only about 1659 hours of sunshine per year, known for its frequently overcast and rainy skies.
In Chicago, USA, the annual sunshine averages 2520 hours, contributing to its humid continental climate.
Adelaide, Australia, enjoys 2770 hours of sunshine annually, with long, sunny summers.
Related Climate Data for Cabinda
February, Cabinda’s wettest month, receives 156 mm (6.1 in) of rainfall and has a maximum daytime temperature of 30°C (86°F). During the driest month July you can expect a temperature of 25°C (77°F).
For more detailed insights into the city’s temperatures, check out our Temperature page. To explore more about precipitation patterns, visit our Cabinda Precipitation page.


